
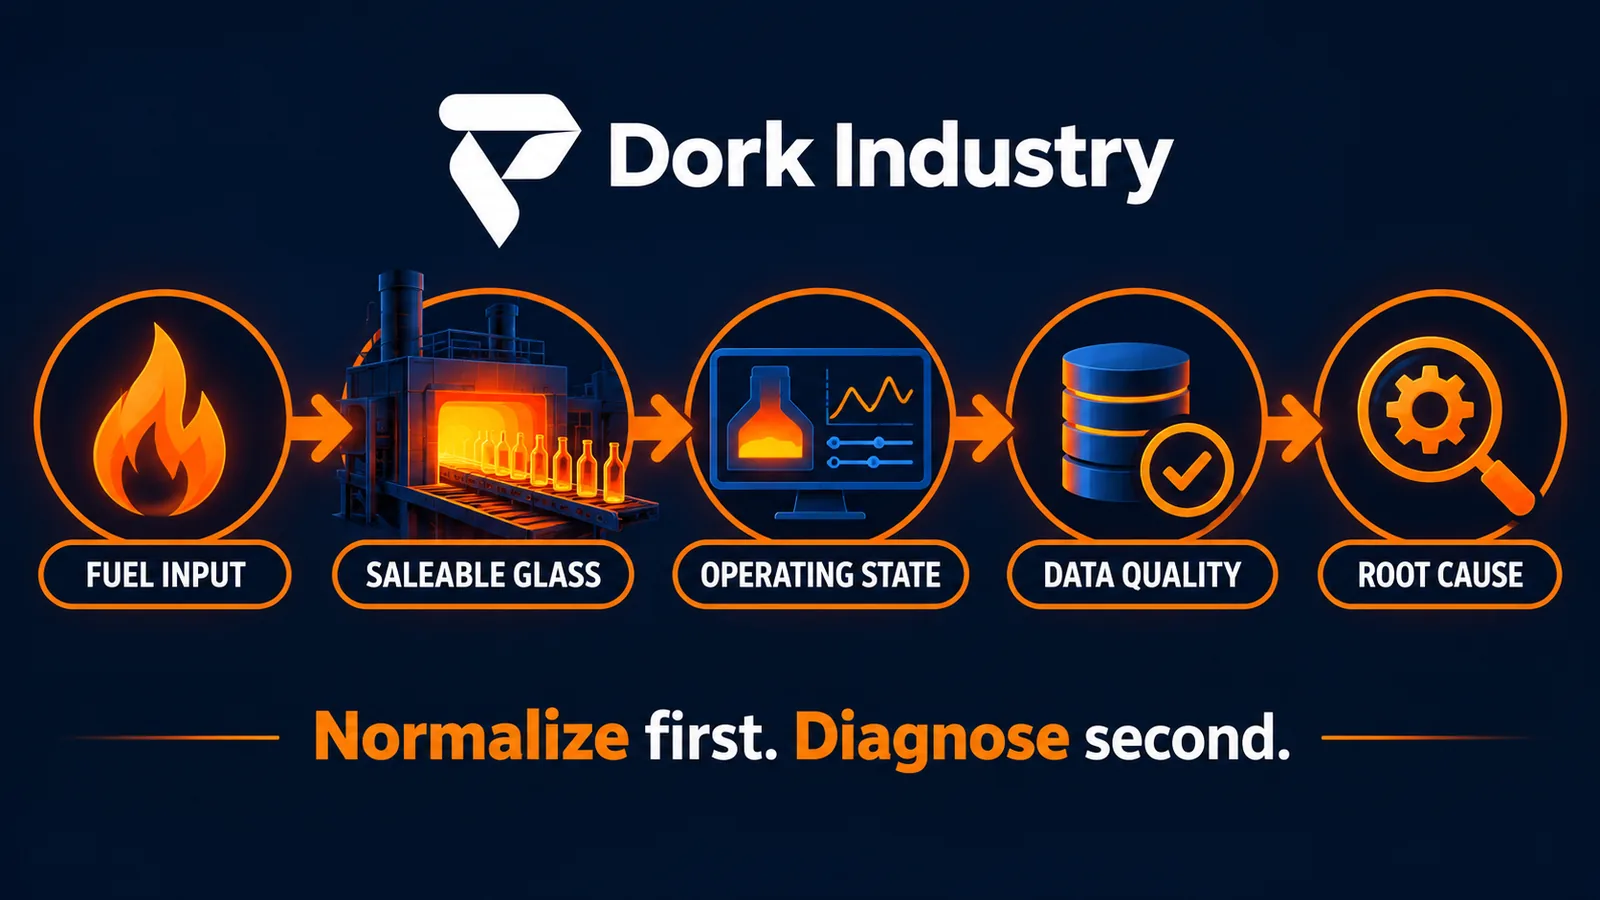
Glass furnace specific energy consumption rises when the furnace uses more energy for each tonne of saleable glass, but the cause is rarely visible in the monthly fuel bill. Pull rate, cullet ratio, glass colour, electric boosting, air-fuel balance, idle periods, quality losses, furnace ageing and faulty measurements can all move the number. The right first step is to normalize comparable operating states, verify the data and test one cause at a time.
By Dork Industry Editorial Team · Reviewed for industrial IoT, energy-data design and operational decision support · Updated October 2026
What is glass furnace specific energy consumption?
Glass furnace specific energy consumption, commonly shortened to SEC, is the energy supplied to the defined furnace system divided by the quantity of glass produced within the same boundary and period. Plants may report gigajoules per tonne, kilowatt-hours per tonne or fuel units per tonne. The unit matters less than a stable definition.
“Energy supplied” must specify whether it includes fossil fuel, electric boosting, batch or cullet preheating and relevant auxiliaries. “Glass produced” must specify whether the denominator is molten pull, packed output or saleable output. Mixing definitions can create an apparent improvement or deterioration that never occurred in the furnace.
Why does the monthly fuel bill hide the cause?
A bill measures purchased energy across a long period. It does not explain which operating state consumed it. If production falls while the furnace remains hot, energy per tonne can rise even when hourly fuel flow is unchanged. Conversely, higher output may reduce SEC while total fuel use rises. Quality losses can also make saleable SEC worse without changing molten pull.
- Fuel and production timestamps do not align.
- One meter feeds several furnaces or downstream loads.
- Reported pull differs from weighed or saleable output.
- Cullet ratio, batch moisture, colour or composition changes.
- Electric boosting is excluded from the numerator.
- Stops, colour changes and unstable transitions are averaged with steady production.
- Defects and breakage reduce the good-tonnage denominator.
What should you check before blaming the furnace?
Run a data-integrity check before changing combustion settings. A wrong conversion factor, drifting flow meter or double-counted total can produce a convincing but false trend.
- Draw the physical energy boundary and list every meter inside it.
- Check units, calorific-value treatment, pressure and temperature compensation.
- Compare meter totals with supplier billing and independent checks.
- Align fuel, boosting and production intervals to one clock.
- Reconcile molten pull, packed tonnes, cullet return and saleable output.
- Mark maintenance, downtime, colour changes and abnormal campaigns.
Recent furnace-performance research emphasizes data reconciliation and gross-error detection before modelling. That is an important commercial lesson: a sophisticated model built on inconsistent measurements can recommend the wrong intervention with great confidence.
Which variables can make SEC rise legitimately?
| Variable | Why SEC can change | Diagnostic comparison |
|---|---|---|
| Pull rate | Fixed heat losses are spread across fewer or more tonnes | Compare within narrow pull-rate bands |
| Cullet ratio | Cullet generally changes melting demand and batch behaviour | Compare the same recipe and cullet range |
| Glass colour or composition | Heat transfer and melting requirements differ | Separate campaigns instead of using one baseline |
| Electric boosting | Fuel may fall while electricity rises | Use total equivalent energy and report both components |
| Furnace age | Refractory condition and heat loss can change during a campaign | Track long-term drift separately from shift variation |
| Quality yield | Good tonnes fall while melting energy continues | Report both molten-pull SEC and saleable SEC |
| Transitions and stops | The furnace remains thermally loaded without normal output | Classify stable, transition, idle and recovery states |
How should a glass furnace SEC dashboard work?
A useful dashboard begins with the decision, not the chart. The furnace manager needs to know whether the change is measurement error, production context, combustion behaviour, heat loss or quality loss—and what evidence supports the next safe check.
Show four layers
- Outcome: total energy, SEC per molten tonne, SEC per saleable tonne and quality yield.
- Context: pull, cullet, recipe, colour, boosting, batch moisture, downtime and campaign age.
- Process: zone temperatures, fuel flow, combustion air, flue oxygen where available, pressure and relevant regenerator signals.
- Evidence quality: missing data, frozen sensors, calibration status, manual overrides and reconciliation error.
SymphonyAI’s glass-furnace application illustrates normalized SEC, baseline comparison, gas flow, boosting and air-gas ratio. CelSian’s energy-balance software uses process data to visualize energy carriers. Glass Service reports normalized SEC over time, while Siemens focuses on visual furnace-condition and temperature monitoring. These products show useful pieces; the plant still needs its own boundary, operating-state definitions and decision workflow.
What should alerts say?
An alert should describe a condition that a person can verify. “SEC high” is weak. A better alert states that saleable SEC exceeded the comparable-state baseline for a defined duration while pull, recipe and boosting remained within their bands, and it lists any suspect instruments.
Do not allow software to automatically change burner or air settings unless the control system, safety engineering and operational governance were specifically designed and validated for closed-loop action. For most MSME deployments, analytics should prioritize investigation and require an authorized human decision.
What can and cannot be automated?
| Good automation candidates | Keep human review |
|---|---|
| Time alignment, unit conversion and SEC calculation | Combustion and safety-critical setpoint changes |
| Operating-state classification | Interpretation of unusual flame, crown or glass conditions |
| Comparable-state baseline and trend detection | Choice of corrective intervention |
| Missing, frozen or implausible sensor flags | Validation of whether a sensor is physically trustworthy |
| Shift report and investigation checklist | Approval of maintenance, recipe or campaign changes |
Is your SEC trend real?
Dork Industry can map the energy boundary, audit meter and production timestamps, and build a small diagnostic view before you invest in a full monitoring platform.
Request an instrumentation-readiness assessment support@dorkindustry.com
How do you distinguish measurement, process and heat-loss problems?
| Pattern | Possible explanation | First evidence to inspect |
|---|---|---|
| Sudden step with no process change | Meter, scaling, data tag or denominator change | Raw totals, calibration, configuration and parallel measurement |
| SEC worsens at low pull | Fixed thermal losses spread across fewer tonnes | SEC-versus-pull curve for comparable recipes |
| Fuel SEC improves but total SEC does not | Electric boosting shifted the energy source | Fuel and electricity on one equivalent-energy basis |
| Molten SEC stable, saleable SEC worse | Quality or forming losses | Defect, breakage and packed-output records |
| Slow campaign drift | Ageing, leakage, refractory or regenerator degradation | Long-term normalized baseline plus inspections |
| Shift-specific increase | Operating practice, input variation or unrecorded event | Event log, batch data and shift handover notes |
Should you buy, configure or build?
Buy when a specialist platform already supports your furnace type, tags, historian and analysis requirements. Configure an existing SCADA, historian or energy-management system when the data is reliable and the gap is context, calculation and workflow. Build a focused application when several legacy sources must be reconciled, plant terminology is distinctive, or a small diagnostic pilot must prove value before a large platform investment.
A hybrid approach is common: PLC/SCADA remains the source for process signals, a historian stores time-series data, ERP or production systems provide tonnes and quality context, and a web application calculates comparable-state SEC and manages investigations. Dork Industry’s custom web application development service can support this integration layer without replacing stable control infrastructure.
What should a 30-day diagnostic sprint include?
- Week 1 — boundary and trust: draw meters and energy flows; reconcile a sample period; agree the numerator, denominator and time basis.
- Week 2 — context: join pull, saleable output, cullet, recipe, colour, boosting, downtime and quality data; label steady and transition states.
- Week 3 — baseline: compare like-for-like periods; quantify missing data; identify one repeatable abnormal pattern.
- Week 4 — safe test: investigate one hypothesis with furnace, production and maintenance owners; record the decision, change and outcome.
Use this acceptance checklist
- The energy boundary is written and approved.
- Fuel, electricity and production share aligned timestamps.
- Molten and saleable SEC are both visible.
- Comparable operating states are defined.
- Missing and suspect measurements are visible.
- An operator can explain why an alert appeared.
- One investigation was completed without unsafe automatic control.
- The expected full-scale integration and maintenance owner are named.
Why is Firozabad commercially relevant?
The target-market brief identifies Firozabad as a major glass cluster covering blown glassware, chandeliers, vials, laboratory and automotive glass, with furnace fuel monitoring and breakage analytics as relevant software needs. India’s Bureau of Energy Efficiency has also published energy mapping for glass and refractory MSMEs, including Firozabad product segments and SEC figures. This makes the location relevant to the operating problem rather than a decorative keyword.
Those published figures are useful sector context, not a target for an individual furnace. Each plant must normalize for furnace type, product, pull, cullet, age and boundary before comparing performance.
Build evidence before buying equipment
Dork Industry provides industrial IoT integration, custom dashboards, data-quality checks and proof-of-concept development. Start with one furnace, one trusted boundary and one decision the plant needs to make.
Discuss the pilot on WhatsApp Email support@dorkindustry.com
Frequently asked questions
Is lower furnace SEC always better?
Not by itself. A lower number can result from a changed boundary, higher pull, excluded electricity or poorer quality accounting. Confirm definitions and verify that safety, glass quality, emissions and furnace life remain within approved limits.
Should SEC use molten or saleable tonnes?
Use both. Molten-tonne SEC reflects melting performance, while saleable-tonne SEC incorporates downstream quality yield. The difference helps separate furnace-energy changes from forming, annealing, inspection and breakage losses.
How much historical data is required?
Begin with enough data to capture comparable steady states and known transitions. Data quality and contextual labels matter more than collecting years of mixed operating conditions. A short, verified dataset can outperform a large untrustworthy archive.
Can AI optimize a glass furnace automatically?
AI can identify patterns and recommend investigations or setpoints, but automatic action requires safety engineering, control-system validation, constraints and accountable human governance. A first pilot should normally remain advisory.
What is the first deliverable?
A trusted SEC calculation, operating-state segmentation and an evidence pack for one abnormal period. This is more valuable than a large dashboard that cannot explain its denominator or sensor quality.
Sources and methodology
Competitor capabilities were reviewed from SymphonyAI, CelSian, Glass Service, Siemens and iFactory. Technical grounding includes the Bureau of Energy Efficiency’s glass-sector mapping, peer-reviewed work on glass-furnace data reconciliation and energy modelling, and established furnace benchmarking literature.
- Bureau of Energy Efficiency: Glass and refractory sector energy mapping
- SymphonyAI glass furnace KPI monitoring
- CelSian Energy Balance Model
- Glass Service data management and normalized SEC
- Siemens furnace monitoring system
- Peer-reviewed glass-furnace data reconciliation study
Important: This article is operational technology guidance, not combustion, process-safety or engineering approval. Furnace changes must be reviewed and executed by qualified plant, combustion, controls and safety professionals.