
Can Custom Software Development Find Out Where Your Tripled Cloud and API Bill Is Really Going?
Custom software development can tell you exactly where your tripled cloud and API bill is going. Yes: a cost-observability layer built for your billing shape reveals what the console never does — which service, which team, which customer, and which runaway retry loop is spending your money. A bill that triples in one quarter is almost never a pricing problem. It is a visibility problem.
This article traces where tripled cloud bills go, why nobody notices until the invoice lands, what data your provider already gives you, what a concrete intervention looks like, what it must never do alone, and how to test cost control in a 30-day pilot.

Where does a tripled cloud bill actually go?
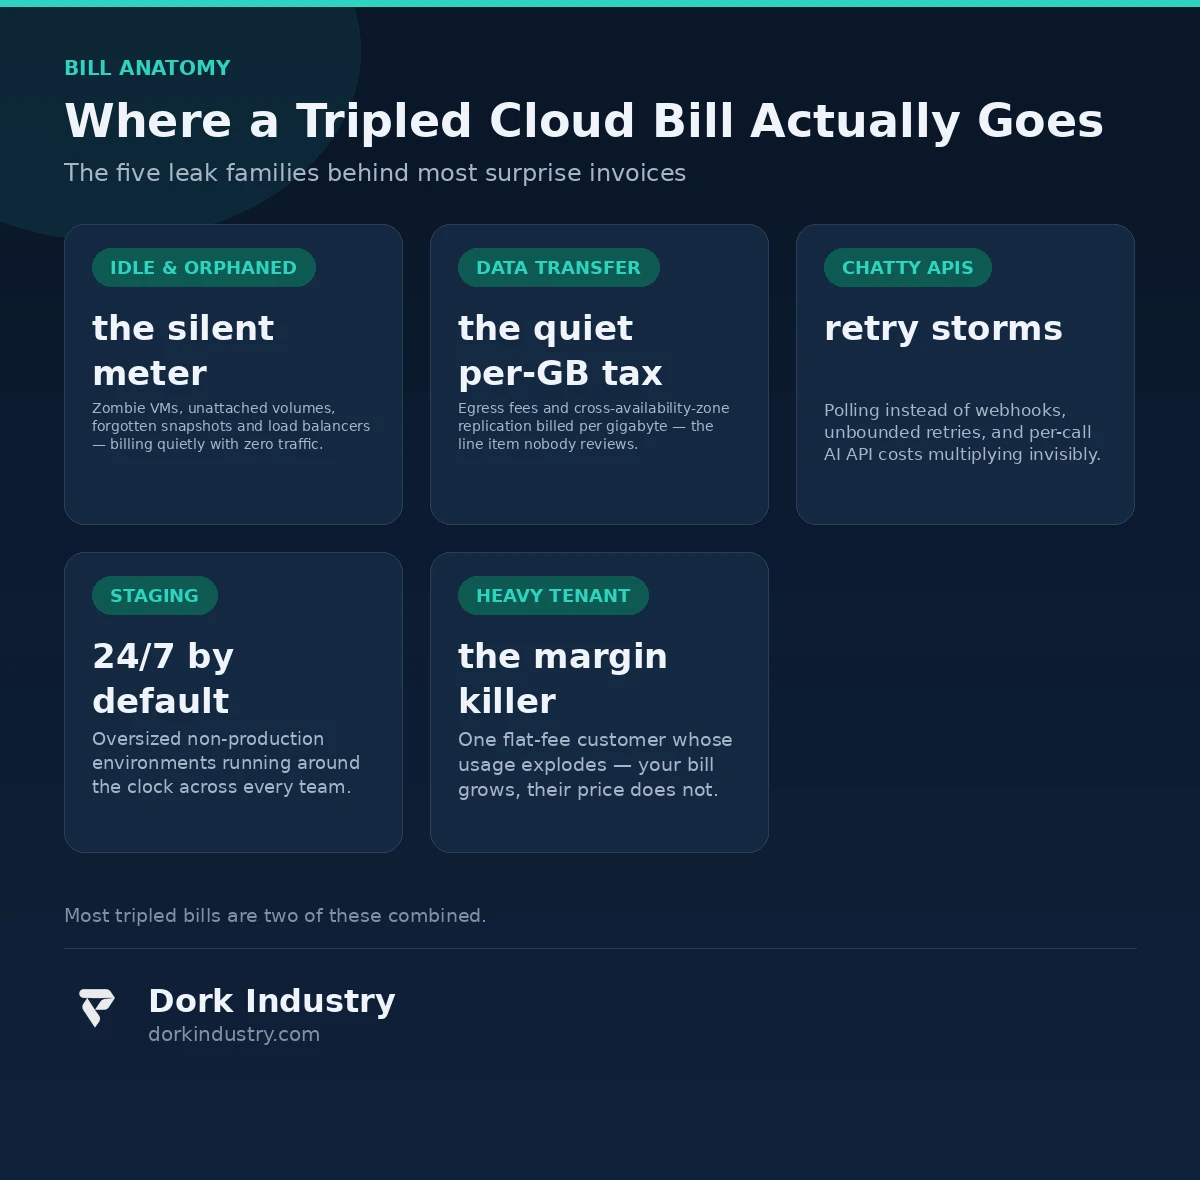
Almost every tripled bill is one of five leak families — or two combined.
Are idle and orphaned resources still billing you?
The most boring and the most common leak. Virtual machines spun up for a migration that finished months ago. Unattached storage volumes and snapshots from deleted instances. Load balancers with no healthy targets. These resources send no traffic, appear on no dashboard, and are never “down” — so nobody touches them. They are the most reliable finding of a first cost audit: no debate needed to fix, and deleting them never breaks anything that matters.
Is data transfer the quiet tax on your bill?
Compute gets the attention; data transfer takes the money. Egress fees charge you every time data leaves the provider’s network, and cross-availability-zone traffic — which feels like it should be free because it is “inside your own infrastructure” — is billed per gigabyte. One misconfigured replication job, or an API returning full payloads where a summary would do, can add five figures a month with no new feature shipped. Nobody reviews data transfer because no single engineer owns it.
Are chatty APIs and retry storms multiplying your usage?
This is where the “API bill” half of the problem lives. An application polling a third-party API every 30 seconds instead of consuming webhooks. Unbounded retry logic hammering a failing endpoint thousands of times an hour — paying per call. And increasingly, AI API calls: a feature silently sending every user message to a large language model, with retries on timeout, can turn a free-tier user into a costly API consumer. Service-level billing hides all of this behind a single “API usage” line.
Are development and staging environments living like production?
Production gets the scrutiny; five non-production environments run the same oversized instances 24 hours a day because “it’s only dev.” Multiply one oversized staging stack by five teams, keep it running nights and weekends, and non-production compute quietly becomes a quarter of the bill. Scheduled shutdowns are among the cheapest wins available — and the least glamorous, which is why nobody prioritizes them until the invoice forces it.
Did one customer’s usage explode unchecked?
For multi-tenant SaaS businesses, this is the expensive one. One large customer starts using your platform heavily — thousands of exports, millions of AI API calls routed through your keys — and because you bill them a flat monthly fee, their usage becomes your margin problem. The bill shows “API usage up 400%”; nothing shows that 80% of it belongs to one tenant. Per-customer attribution turns cost management into a pricing and profitability decision.
Why does the bill explode without anyone noticing?
Why doesn’t the invoice say what happened?
The invoice is an accounting artifact, not a diagnostic one. It aggregates by service and region — “what category grew” — and never answers “which deploy, which customer, which integration changed the slope?” No native view is organized around that question.
Who actually owns the bill?
Usually nobody. Engineers ship and the bill is a side effect; finance pays it as overhead. Comparing monthly totals detects nothing until a quarter has passed. Cost ownership must be assigned to a person with the authority to change usage and the visibility to see it.
Why didn’t your alerts fire?
Because they were never set — or set so loosely they only fire on catastrophe. Alerts routed to a shared inbox nobody reads are decoration. With spiky usage, untuned anomaly alerts either cry wolf daily (and get muted) or stay silent through a real spike. Alerting needs a human reviewing false positives for the first month.
What does “no tagging policy” cost you?
Most companies discover 40–60% of their estate is untagged — nearly half the bill is a black box before analysis begins. No tags, no attribution, no accountability.

What data do you already have about your spend?
You likely have more data than you think; it is just not assembled into an answer. According to AWS’s Billing and Cost Management documentation, cost allocation tags let you organize costs by team, application, or environment, with data exportable to your warehouse or BI tool, plus Cost Anomaly Detection and Budgets for tracking thresholds. According to Microsoft’s Cost Management documentation, Azure supports cost alerts, anomaly alerts, tag inheritance, and splitting shared costs across teams. Google Cloud offers billing export to BigQuery; your API gateway logs already record usage per API key and endpoint.
The pattern is consistent: raw data exists in exports, APIs, and logs. What is missing is a layer joining usage to tags to teams to customers to dollars, on a cadence a human can act on. That join is exactly what custom software development is for: it fits your accounts, tenants, and pricing instead of forcing your business into a generic tool’s model.
What does the technology intervention look like, concretely?
Can a mandatory tagging policy attribute every dollar?
Every resource gets four tags: owner, team, environment, cost-center or customer. Enforcement happens at provisioning time — pipelines and infrastructure-as-code templates reject untagged resources before they exist. Historical untagged resources get a 30-day amnesty: claim them or they are flagged for review. It sounds bureaucratic, and it is the highest-ROI step in cost management.
Can a daily cost digest replace the surprise invoice?
A scheduled job pulls the billing export daily, joins usage to tags, and computes per-service deltas against a 7-day average. One digest: total yesterday, top five movers, anything past a threshold. The same people see the same email every morning; anything unexplained gets a name attached within 24 hours.
Can anomaly detection flag a spike within hours?
Simple moving-average bands compare current usage against the baseline per tagged group, and alerts go to the resource owner — not a shared inbox. The first month produces false positives that a human tunes away. By month two, a genuine spike gets flagged within hours, not discovered in next month’s invoice.
Can API metering show which customer burns your margin?
Middleware in your API gateway records, per API key and endpoint, request counts and upstream cost. Joined with customer records, this produces a per-customer cost report: revenue minus true infrastructure cost, per tenant, per month. The customer costing you $400 a month in API fees on a $99 plan is a pricing problem, not an engineering one.
What does the math look like? An illustrative example
Consider a mid-size SaaS company whose bill went from $18,000 a month to $54,000 in one quarter, with no tripling of revenue. A first audit typically finds a breakdown shaped like this. These are illustrative figures with stated assumptions, not benchmarks.
- Idle and orphaned resources — ~$7,000/month. Assumption: 120+ instances and volumes left from three completed migrations, plus forgotten snapshots.
- Data transfer — ~$6,000/month. Assumption: cross-availability-zone replication at full fidelity for a workload that tolerates compressed, batched sync.
- One heavy tenant — ~$12,000/month in API costs. Assumption: a single enterprise customer on a flat-fee plan whose AI-feature usage grew 20x after their own rollout.
- Non-production environments — ~$11,000/month. Assumption: five staging stacks on production-grade instances, running 24/7 across four teams.
The remaining ~$4,000 of the increase is legitimate growth — compute that earns its cost. That distinction is the entire point. After cleanup and a corrected pricing conversation with the heavy tenant, the sustainable bill settles around $24,000 a month: roughly $30,000 a month, or $360,000 a year, saved against the tripled baseline. The waste concentrates in a few identifiable leaks, and a structured audit finds them in weeks — invoice-staring never does.
Should you build or buy? An honest breakdown
Not every tripled bill needs custom software development. The honest options, in order of investment:
| Approach | Best for | Relative investment | Where it breaks |
|---|---|---|---|
| Native console + billing exports | Single account, small team | Free, already included | No per-customer attribution or multi-account joins; analysis stays manual |
| Open-source (OpenCost, Infracost) | Kubernetes-heavy teams | Low, self-hosted | Covers compute; weak on API metering and per-tenant margins |
| FinOps platforms (Apptio, CloudHealth) | Enterprises with FinOps teams | High subscription | Generic model that may not fit your tenants or multi-API reality |
| Custom cost-observability layer | Multi-tenant SaaS, per-customer margins, multi-cloud/API spend | Highest | Overkill if your bill is one account and one team’s problem |
At Dork Industry, we regularly advise companies against custom builds when native tooling plus a tagging policy would answer their question. If your mystery is “which service grew,” the console is enough. If it is “which customer, which team, which API pattern grew — and what do we do about it,” you have outgrown generic tooling.
What must the system never do alone?
Cost-observability tooling earns trust by being precise about its boundaries:
- Never auto-terminate production resources based on cost signals. An “expensive” resource may be running your revenue pipeline. Flagging is the system’s job; shutdown belongs to the owner.
- Never throttle a paying customer’s API automatically. Cutting off a customer to protect margin is a business decision with legal and relationship consequences.
- Never switch pricing tiers or buy reserved capacity silently. Commitments need finance sign-off and demand forecasts — an automation locking you into a three-year commitment “because it saves money” is a liability.
- Never rewrite billing data. The cost ledger is immutable; if it can be edited, every downstream number becomes untrustworthy.
- AI should propose actions, never execute them. “These 40 instances look idle — approve shutdown?” is the right interaction. An agent terminating infrastructure on its own authority will eventually terminate the wrong thing on a bad day.
How do you test cost control in 30 days?
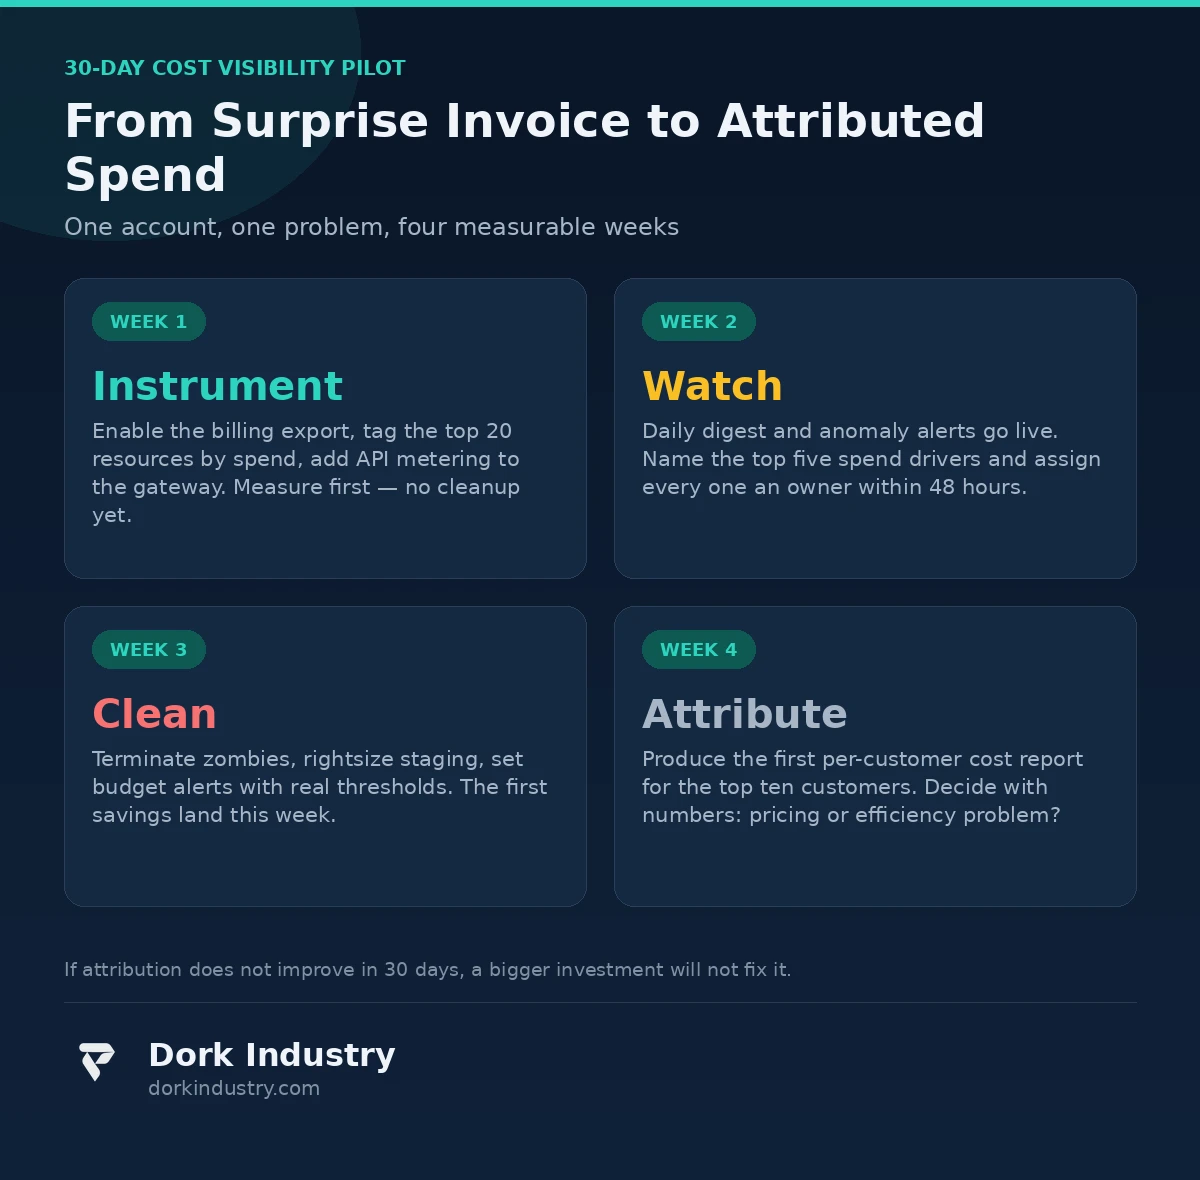
The lowest-risk path is a scoped pilot: one cloud account, one cost problem, measurable outcomes.
- Week 1 — instrument. Enable the billing export, tag the top 20 resources by spend, add API metering to your gateway. No cleanup yet — just measurement.
- Week 2 — watch. Daily digest and anomaly alerts go live. First review: name the top five spend drivers and assign each an owner.
- Week 3 — clean. Terminate zombies, rightsize staging, set budget alerts with real thresholds. First savings land this week.
- Week 4 — attribute. Produce the first per-customer cost report for your top ten customers. Decide with numbers whether heavy tenants are a pricing or efficiency problem.
Measure the pilot on four numbers: spend attributable to an owner (target: above 90%), time to detect a spike (target: hours), dollars saved in week 3, and whether the per-customer report changed any pricing decision. If attribution does not improve in 30 days, a bigger investment will not fix it either.
What actually drives the cost of building cost observability?
Like any custom-built operational tool, pricing varies with scope:
- Accounts, clouds, and APIs to ingest: one account is a weekend; five accounts across three providers plus paid APIs is an integration project
- Attribution granularity: service-level totals are cheap; per-request, per-tenant metering with pricing joins is where the engineering goes
- Alerting depth: email digests vs Slack routing, on-call escalation, and anomaly tuning over the first month
- Historical backfill: a year of billing history for trend analysis vs starting fresh
- Ownership afterward: a system nobody maintains rots within two quarters — budget for upkeep or keep it simple
Anyone quoting a fixed price without asking how many accounts, how many tenants, and what granularity you need is guessing.
Frequently asked questions
Can cloud cost tools fix the bill automatically?
The easy half — terminating idle resources, scheduling non-production shutdowns — is safe to automate. The expensive half — pricing decisions, tenant conversations, architecture changes — cannot be automated away.
Why doesn’t AWS Cost Explorer already answer this?
Cost Explorer answers “which service grew,” not “which customer, team, or API pattern grew” — unless your tagging and metering are already excellent, in which case you would not have a mystery bill. The gap is attribution, not visualization.
How long until cost visibility pays for itself?
The first cleanup — idle resources, oversized staging — typically lands within two to three weeks and often covers the engagement’s cost. Per-customer attribution pays over quarters, through corrected pricing.
Should we let an AI agent manage our cloud spending?
Let it watch, never let it act alone. AI is good at pattern detection — spotting an unusual spend slope — and bad at business judgment, like whether shutting down a costly service breaks a customer commitment. The safe architecture is agent-as-advisor: it proposes, a human approves.
What does a 30-day cost-visibility pilot cost?
A scoped pilot — one account, billing export, tagging policy, daily digest, anomaly alerts, one review cycle — is a fraction of a full multi-cloud platform. Its job is to prove attribution is possible in your environment. Request a pilot scoping call for a concrete estimate.
The bottom line
A tripled cloud and API bill is not a mystery of economics. It is a stack of specific, findable leaks hidden behind aggregated invoices: idle resources, untaxed data transfer, chatty APIs, runaway tenants, oversized staging. The fix is not cheaper cloud. It is attribution — tags naming an owner, metering naming a customer, a daily cadence catching spikes in hours instead of quarters.
Start with the audit, instrument one account for 30 days, and let attributed numbers — not the invoice total — decide whether custom software development for cost observability earns its place in your stack.
Request Your Free Cloud Cost Leak Assessment
Before your next invoice lands, find out which services, teams, and customers are driving your cloud and API spend. In a free assessment, we map your billing exports, tagging gaps, and API metering — and show you the top leaks we would fix first, with the math and a 30-day action plan.
Request your free cloud cost leak assessment WhatsApp +91 8210792477
About Dork Industry
Dork Industry (dorkindustry.com) is a custom software development company building mobile apps, AI automation, and IoT systems for businesses across India. Our team designs cost-observability tooling, FinOps integrations, and API metering systems — from 30-day cost audits to full multi-tenant attribution platforms.