
IoT development can catch driver idling and route detours — not by watching your drivers, but by reading the data your vehicles already produce. That is the direct answer: yes, onboard diagnostics and GPS telemetry measure idle time, unauthorized detours and harsh driving event by event; the missing piece is a system that turns that stream into one daily exception list your dispatcher actually reads.
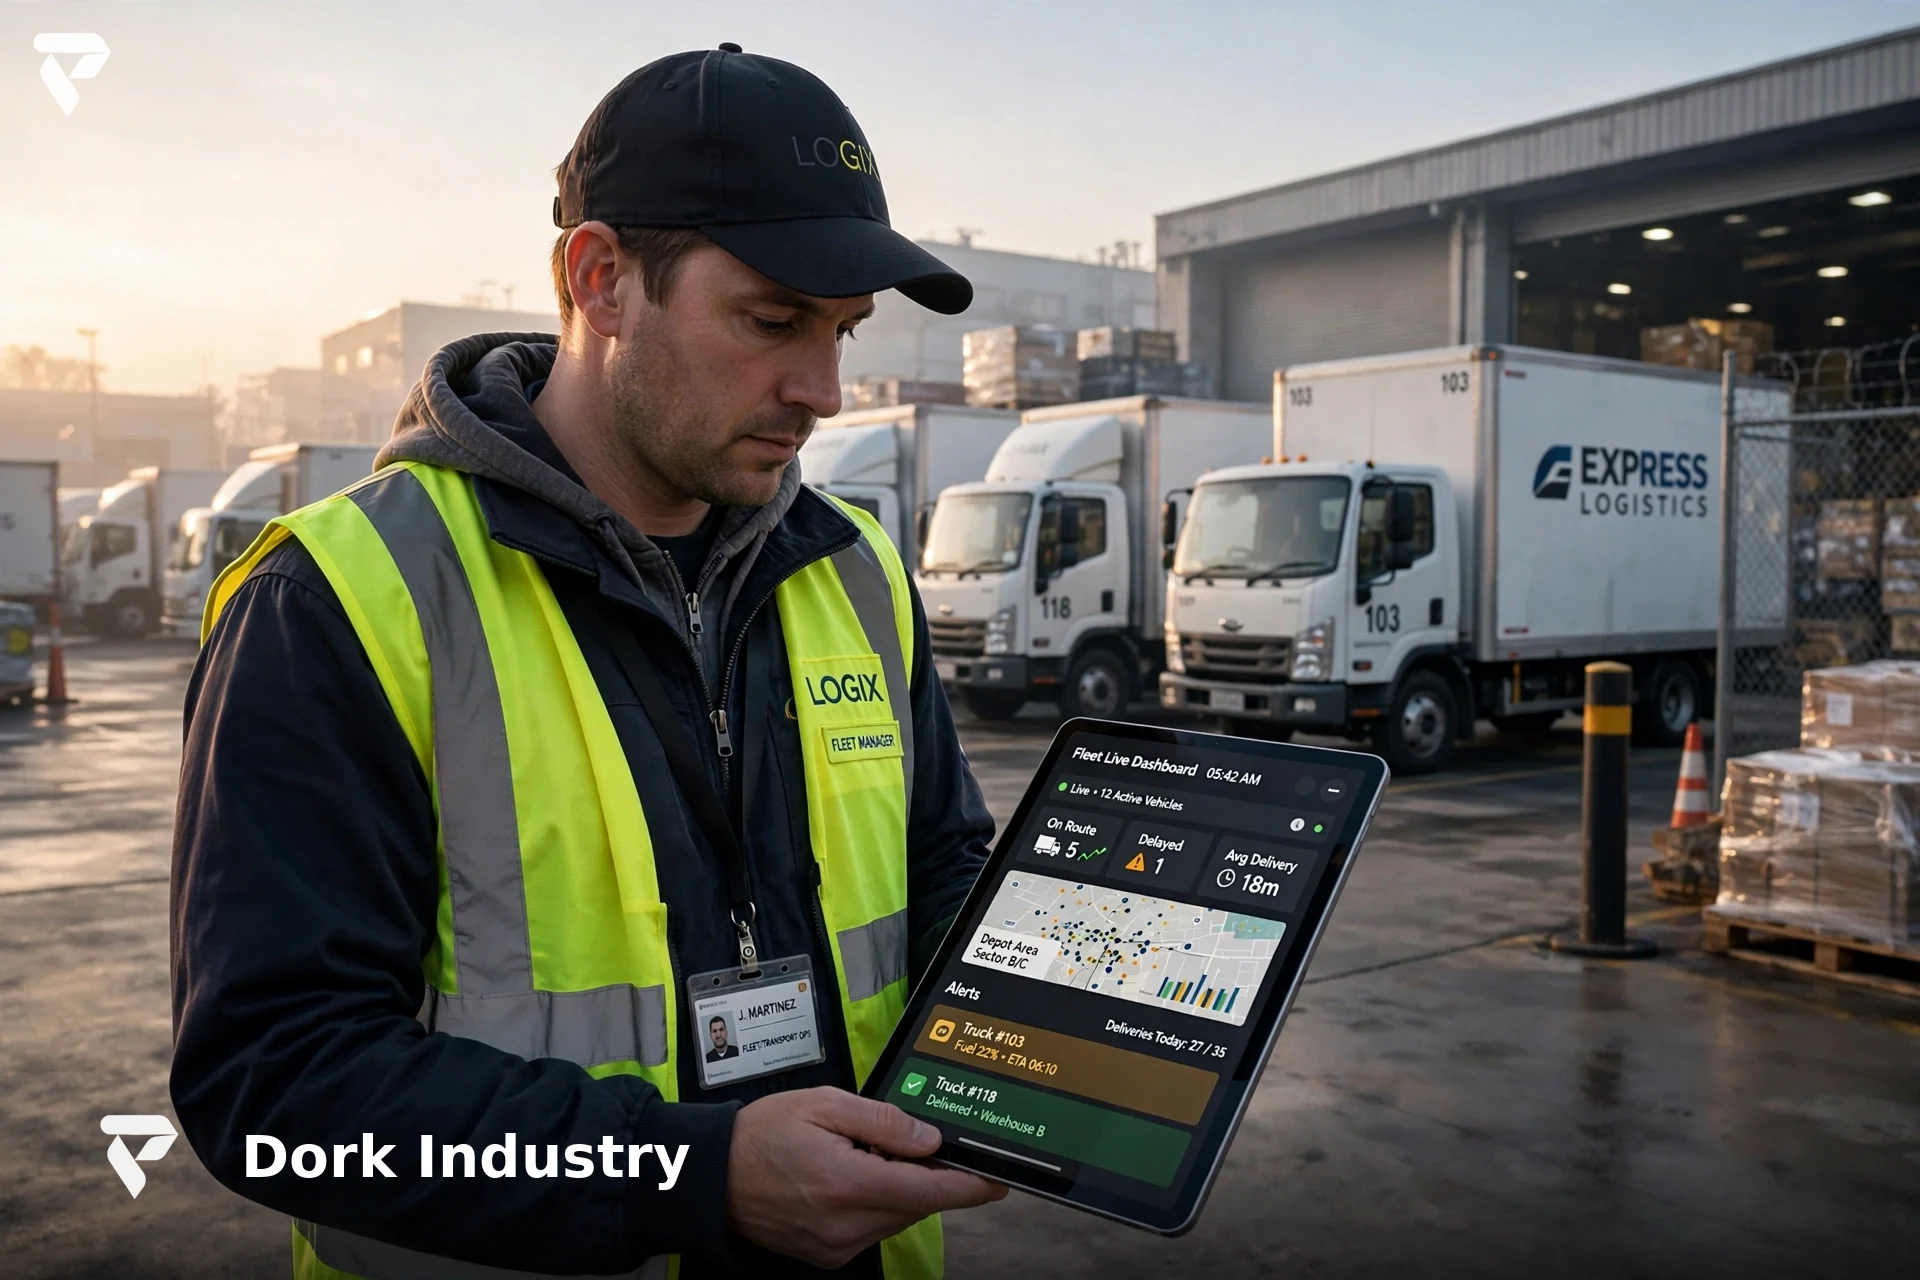
What does driver idling and detouring actually cost a fleet?
The failure is not one catastrophic event. It is thousands of small, invisible leaks — a truck idling twenty minutes at every delivery point, a five-kilometre detour that never appears on any report. Each one looks trivial. Together, they are one of the largest controllable costs in transport.
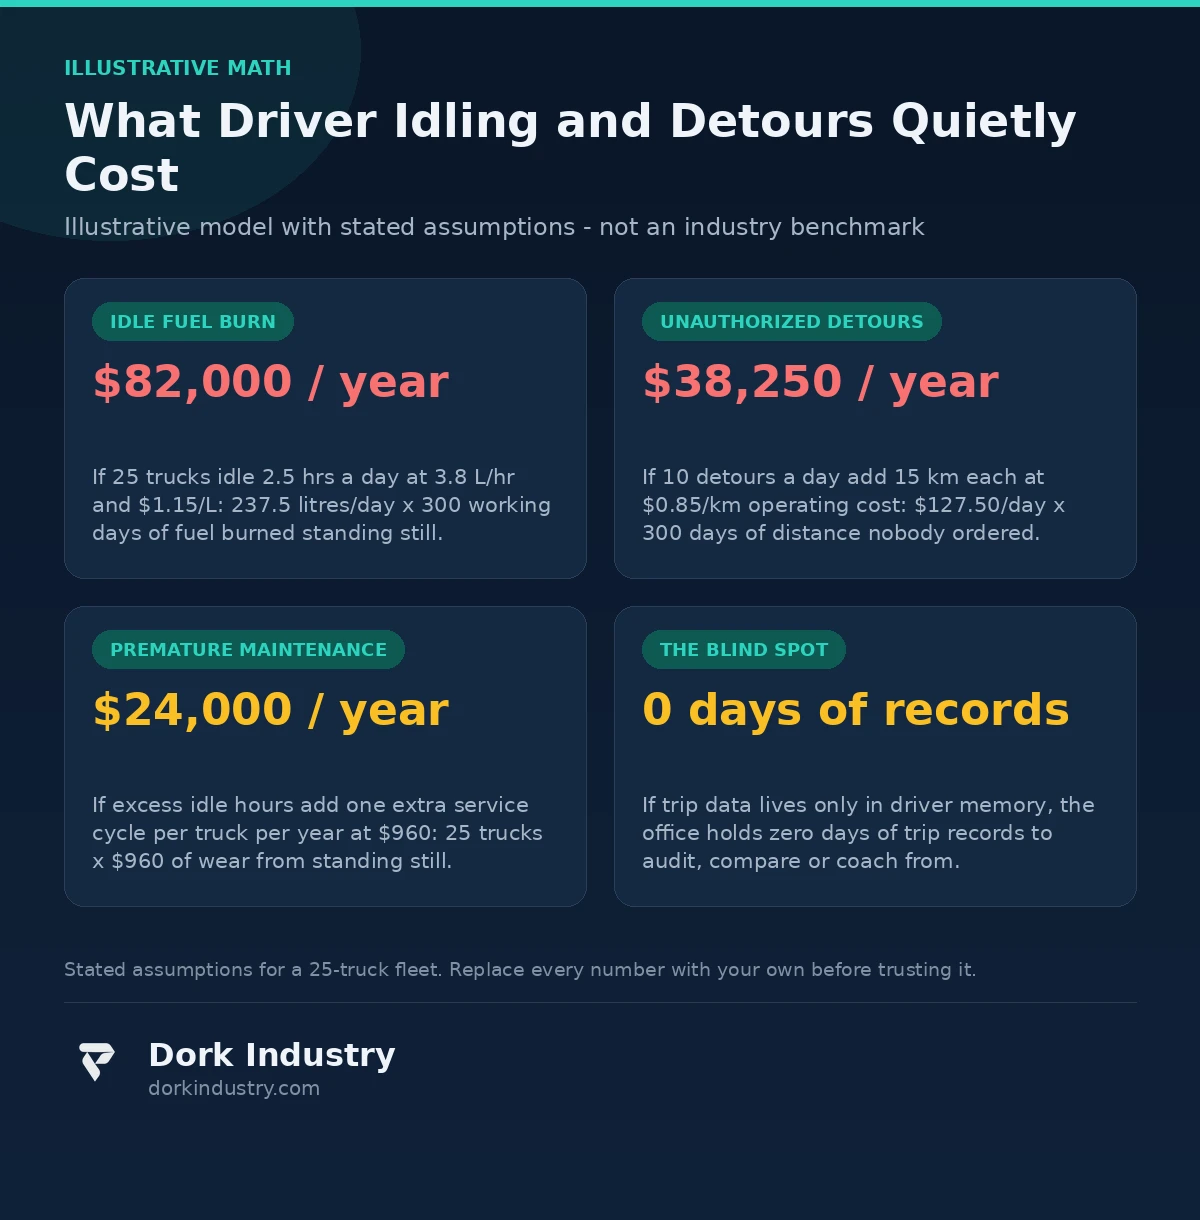
Consider the illustrative model below — stated assumptions, not industry statistics. A 25-truck fleet, 300 working days a year, diesel at $1.15 a litre. Assume each truck idles 2.5 hours a day (waiting at gates, running the cab AC, “keeping the engine warm”) and burns 3.8 litres per idle hour: 25 × 2.5 × 3.8 = 237.5 litres a day, or $273 a day of fuel burned while standing still — roughly $82,000 a year. Now add detours: ten unauthorized detours a day, 15 km each, at $0.85 per kilometre all-in operating cost — $38,250 a year of distance nobody ordered. Then maintenance: idle hours wear engines without moving the odometer, so add one extra service cycle per truck per year at $960 — another $24,000. Total visible leakage: roughly $144,000 a year, or about $5,770 per truck.
Where does the fuel quietly go?
Idling first, always. A heavy truck at idle is a generator nobody is using — it burns fuel, wears the engine, and produces zero revenue kilometres. According to the US Department of Energy’s Alternative Fuels Data Center, Argonne National Laboratory estimates that more than 6 billion gallons of gasoline and diesel are lost to idling every year in the US — worth over $11 billion even at $2 a gallon — and that cutting idle time also reduces engine wear on heavy-duty trucks. The second leak is the detour nobody ordered: personal errands, “shortcuts” that are not shorter, drops made in the wrong sequence. The third is invisible wear — oil contamination, DPF loading and extra service cycles. And the fourth, the one fleets feel but cannot name, is the dispute cost: every claim that “I didn’t idle that long” costs a manager an afternoon, because there is no record either way.
Why don’t trip sheets and driver reports catch it?
Because they measure the wrong thing. A trip sheet records where a truck was supposed to go, not where it went. A driver’s end-of-day report records what the driver remembers, rounded and softened, hours after the fact. Fuel bills arrive aggregated — one number for the whole fleet, with no way to attribute a single litre to a single idle hour. The system does not catch idling because it was built to pay the fuel bill, not to understand it.
The system does not catch idling because it was built to pay the fuel bill, not to understand it. And it is the data that is the problem, not the drivers: most idling is habit, weather, loading-dock queues and instructions nobody clarified; detours are often the driver’s best attempt at a route the dispatcher never optimized. When you finally measure idle hours per driver, the honest fleet owners discover the worst offenders were working the worst routes — data does not just catch waste, it explains it, and the explanation usually changes who you blame.
What vehicle data do you already have?
Your trucks have been recording everything for years — engine RPM, speed, fuel rate, coolant temperature and odometer streaming from the OBD-II diagnostic port on every truck built in the last two decades. You just have not been collecting it.
GPS trackers you already fitted. Many fleets already pay for basic GPS units reporting position every 30–60 seconds. With geofence logic, that raw feed becomes “idling at the warehouse gate” or “stopped 18 minutes at an unapproved location” — without buying a single new sensor.
Fuel cards and odometer logs. Fuel-fill records with timestamps and odometer readings are the ground truth that catches everything else’s lies. A truck that burned 80 litres over 200 km tells its own story; the telemetry just narrates it.
Driver-facing context. Shift rosters, planned routes and delivery schedules from your dispatch system. Telematics without context is noise — an “unauthorized stop” is only unauthorized if the route plan says so. The US trucking industry’s shift to electronic logging devices under FMCSA rules shows the broader point: vehicle-recorded data has already replaced handwritten logs as the trusted source of driving-time truth.
What does an IoT fleet-telemetry system look like in practice?
Concretely, in six stages. Every stage turns data you already own into a decision someone can act on.
Stage 1 — Capture. OBD-II dongles or wired telematics units on five pilot trucks, plus the GPS units already fitted. Every ignition-on event starts a trip record: position, speed, engine RPM, fuel rate, timestamp. According to AWS’s IoT FleetWise documentation, cloud vehicle-data platforms collect near-real-time signals from vehicle fleets and route them to the applications that need them — exactly this collection layer.
Stage 2 — Define. Idle time is not “engine on, speed zero” — that would flag every red light. The system defines events with your rules: idle means engine on, speed zero, longer than 10 minutes. A detour means off the planned corridor by more than 2 km for more than 5 minutes. Definitions are yours; the system just enforces them.
Stage 3 — Match. Every event is matched against context: the planned route, the delivery schedule, the shift roster. A 25-minute idle at the customer’s dock at the scheduled delivery time is a loading delay — a cost to discuss with the customer. The same idle at an unapproved address is a coaching event. Without matching, you have alerts. With it, you have answers.
Stage 4 — Flag. The dispatcher sees one daily exception list: top idlers, unapproved stops, route deviations, harsh events. Not a dashboard of charts — a short list of things worth a conversation. The exception list is the product; everything else is plumbing.
Stage 5 — Coach. Weekly idle rankings go to drivers as numbers, not accusations. The fleet manager coaches the top three idlers with specifics: “Tuesday, 38 minutes at the depot gate — what were you waiting for?” Most idle hours die in this conversation, because most of them were habits nobody had ever measured.
Stage 6 — Verify. Fuel per 100 km, per truck, per week — the one number that tells you whether the system works. Watch it weekly, judge it monthly. No event flag means anything if the fuel curve does not bend.
What must the system never do alone?
This is the boundary section, and for fleet telematics it matters more than the technology. A system that watches drivers can do real harm if nobody draws lines around it.
Never penalize a driver automatically. Telemetry flags events; humans decide what they mean. An idle reading could be a traffic jam, a closed gate, a medical episode. Auto-generated penalties based on raw events are how fleets lose their best drivers to their worst algorithms. Every flag is a conversation starter, never a verdict.
Never report real-time driver location to anyone except dispatch. The dispatch console needs live position for operations. The management dashboard gets aggregates — idle hours, exception counts, fuel trends. Per-driver live tracking visible to the whole company is surveillance, and it poisons the trust the coaching stage needs.
Never override the driver’s judgment on the road. The system can note that a detour happened; it cannot know the road was flooded or the police redirected traffic. The driver’s decision in the moment outranks the planned route, always — the system learns from the deviation, it does not grade it.
Never mix safety events with productivity metrics. Hard-braking events are safety signals for defensive-driving coaching. Idling is a fuel signal. Score them separately. A driver who brakes hard to avoid a collision must never see that event used against a fuel-efficiency score.
Never keep data you do not need. Store trip events and aggregates; expire raw second-by-second location trails. A fleet does not need a permanent minute-by-minute record of where its people were — and keeping one creates a liability bigger than any fuel saving.
When should you NOT build fleet telemetry?
Honest answer: not every fleet should. Fewer than five vehicles? You already know your drivers’ habits — a conversation is cheaper than any system. Drivers who own their trucks? Telemetry on someone else’s asset is a relationship problem, not a data one. Routes that are inherently unpredictable will generate so many “exceptions” that the exception list becomes noise. And if nobody will own the weekly coaching conversation, you simply replace an ignored fuel bill with an ignored dashboard. We say this to prospects plainly; the same honest lens applies to our custom software development work — telemetry is only worth building when a manager will act on what it finds.
What does a 30-day pilot look like?
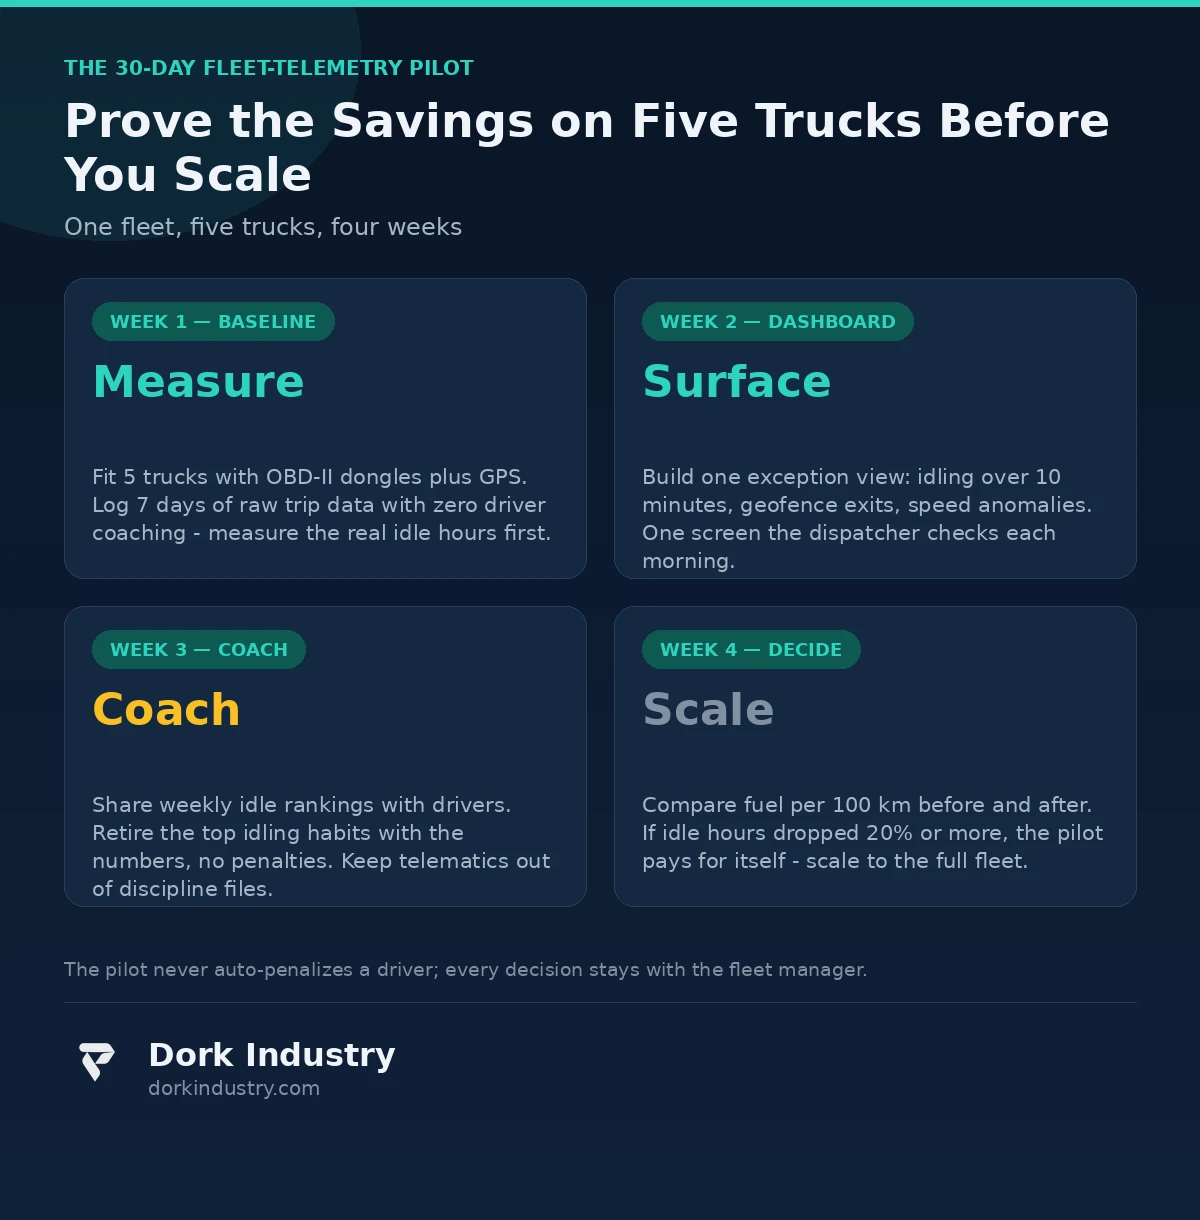
Week 1 — Baseline. Fit OBD-II dongles on five trucks and pull the existing GPS feed. Log one full week of raw trip data with zero driver coaching and zero rule changes. Measure the real numbers: average idle hours per truck-day, detour frequency, fuel per 100 km. Do not tell drivers what you are measuring yet — you want the truth, not the performance.
Week 2 — Exceptions. Build the single exception view: idling over 10 minutes, geofence exits, unapproved stops, speed anomalies. The dispatcher checks it each morning. Every flag gets classified: loading delay, traffic, unknown — and “unknown” is the interesting column.
Week 3 — Coaching. Share weekly idle rankings with the five drivers — numbers only, no penalties, in a private one-on-one. Ask what each top event was. Note which ones were loading-dock queues (a customer problem) and which were habit (a coaching win). Keep telematics out of discipline files entirely.
Week 4 — Decision. Compare fuel per 100 km against week 1. If idle hours dropped 20% or more, scale the idle-cost math to the full fleet and you have the business case. If nothing moved, you learned it without spending a full-fleet budget. The same discipline of small measurable bets runs through our web development engagements.
What drives the cost of a fleet-telemetry build?
Four cost drivers, in order of impact. Fleet heterogeneity: five identical trucks is a weekend; mixed makes and ages mean per-model CAN-bus mapping. Hardware choice: consumer OBD-II dongles cost tens of dollars each but drop connections; rugged wired units cost far more but survive depot heat and vibration. Exception and privacy design: a flag list for dispatch is simple; per-role visibility, data retention and driver-consent flows are a product in themselves. Dispatch integration: matching events against planned routes requires reading your dispatch data; if it exports cleanly, integration is days — if it is a spreadsheet someone emails, the plumbing comes first.
How do manual trip sheets, GPS trackers and IoT telemetry compare?
| Dimension | Manual trip sheets | GPS-only trackers | IoT telemetry |
|---|---|---|---|
| Idle-time visibility | None — nobody writes down waiting time | Inferred from stationary position, no engine data | Measured: engine RPM, fuel rate, duration per event |
| Detour detection | Only if the driver admits it | Route trace visible, deviation must be eyeballed | Automatic: off-corridor events flagged with distance |
| Evidence for coaching | He-said-she-said | A map with no context | Event + route plan + fuel impact, one record |
| Fuel attribution | One fleet-wide bill | Distance-based estimates | Per-truck, per-trip fuel vs. plan variance |
| Driver disputes | Unresolvable | Partially — “the GPS said” | Settled by the matched record, usually amicably |
The bottom line
IoT development does not make your drivers honest — they mostly already are. What it does is replace the argument about what happened with a record of what happened: idle hours measured instead of estimated, detours flagged instead of suspected, fuel attributed per truck instead of pooled into one mysterious bill. If your fleet burns fuel nobody can account for, the question is not whether the vehicles can report it — they already record everything.
Paying for fuel your trucks burn standing still?
Send Dork Industry one week of your fuel fills and dispatch logs. We will compute your real idle-fuel cost against your own numbers, show you what your vehicles’ onboard data already records, and design the five-truck, 30-day pilot for your fleet.
Request a free fleet telemetry assessment WhatsApp +91 8210792477
About Dork Industry
Dork Industry (dorkindustry.com) is a custom software development company building mobile apps, AI automation, and IoT systems for businesses across India. Our team designs fleet-telemetry pipelines, exception dashboards and driver-coaching workflows — from 30-day five-truck pilots to full fleet platforms, with the same rigor we apply to AI automation for business processes.
Frequently asked questions
Can IoT development really catch driver idling?
Yes. Onboard diagnostics report engine RPM, speed and fuel rate in real time, so idle time is measured directly — engine on, speed zero, over your chosen threshold — not estimated from GPS. The system still needs your definition of “idle” and route context, or every red light becomes an exception.
Do I need new sensors on every truck?
Usually not many. Most fleets already have GPS trackers fitted; adding an OBD-II dongle or a wired telematics unit per truck completes the picture. The expensive part is rarely the hardware — it is the exception rules, the dispatch integration and the coaching workflow.
Will drivers resist vehicle telemetry?
They resist surveillance; they accept measurement. The pilots that work share the numbers with drivers, keep telemetry out of discipline files, and lead with coaching instead of penalties. The boundaries in this article — no auto-penalties, aggregates for management, driver’s road judgment wins — are what makes adoption possible.
How much fuel can idle reduction realistically save?
It depends entirely on your baseline, which is why the pilot measures week 1 before changing anything. The illustrative model in this article shows how to compute your own number — 25 trucks idling 2.5 hours a day is an assumption, not a promise. Fleets typically find the week-1 truth surprising either way.
What does a fleet telemetry pilot need from my team?
Three things: access to five trucks for dongle fitting, one week of fuel-fill records, and one dispatcher willing to check the exception list every morning and have the coaching conversations. With those, the pilot hands you the business case for the full fleet in four weeks.