
AI development can forecast festival-season demand from your past sales history — by learning the sales curve of every SKU from two or three seasons of point-of-sale data, separating genuine demand growth from promotion spikes, and recommending order quantities per store weeks before the season begins. That is the direct answer: yes, a well-trained forecasting model consistently beats gut feel on your hero SKUs; no, it should never place purchase orders on its own — the buyer’s judgment stays in the loop on every dollar committed.
This article examines what a bad festival forecast really costs, why demand planning stays a gut-feel decision even with years of POS data on file, what sales data you already own, what an AI-assisted forecasting system looks like in practice, what it must never do alone, when you should not build a custom model, and how to test the idea on a 30-day pilot.
What does a bad festival forecast actually cost?
The expensive failure is not that forecasts are wrong — every forecast is wrong. The expensive failure is that they are wrong in both directions at once: hero SKUs stock out while slow movers pile up in the godown. One error loses margin; the other locks up cash.
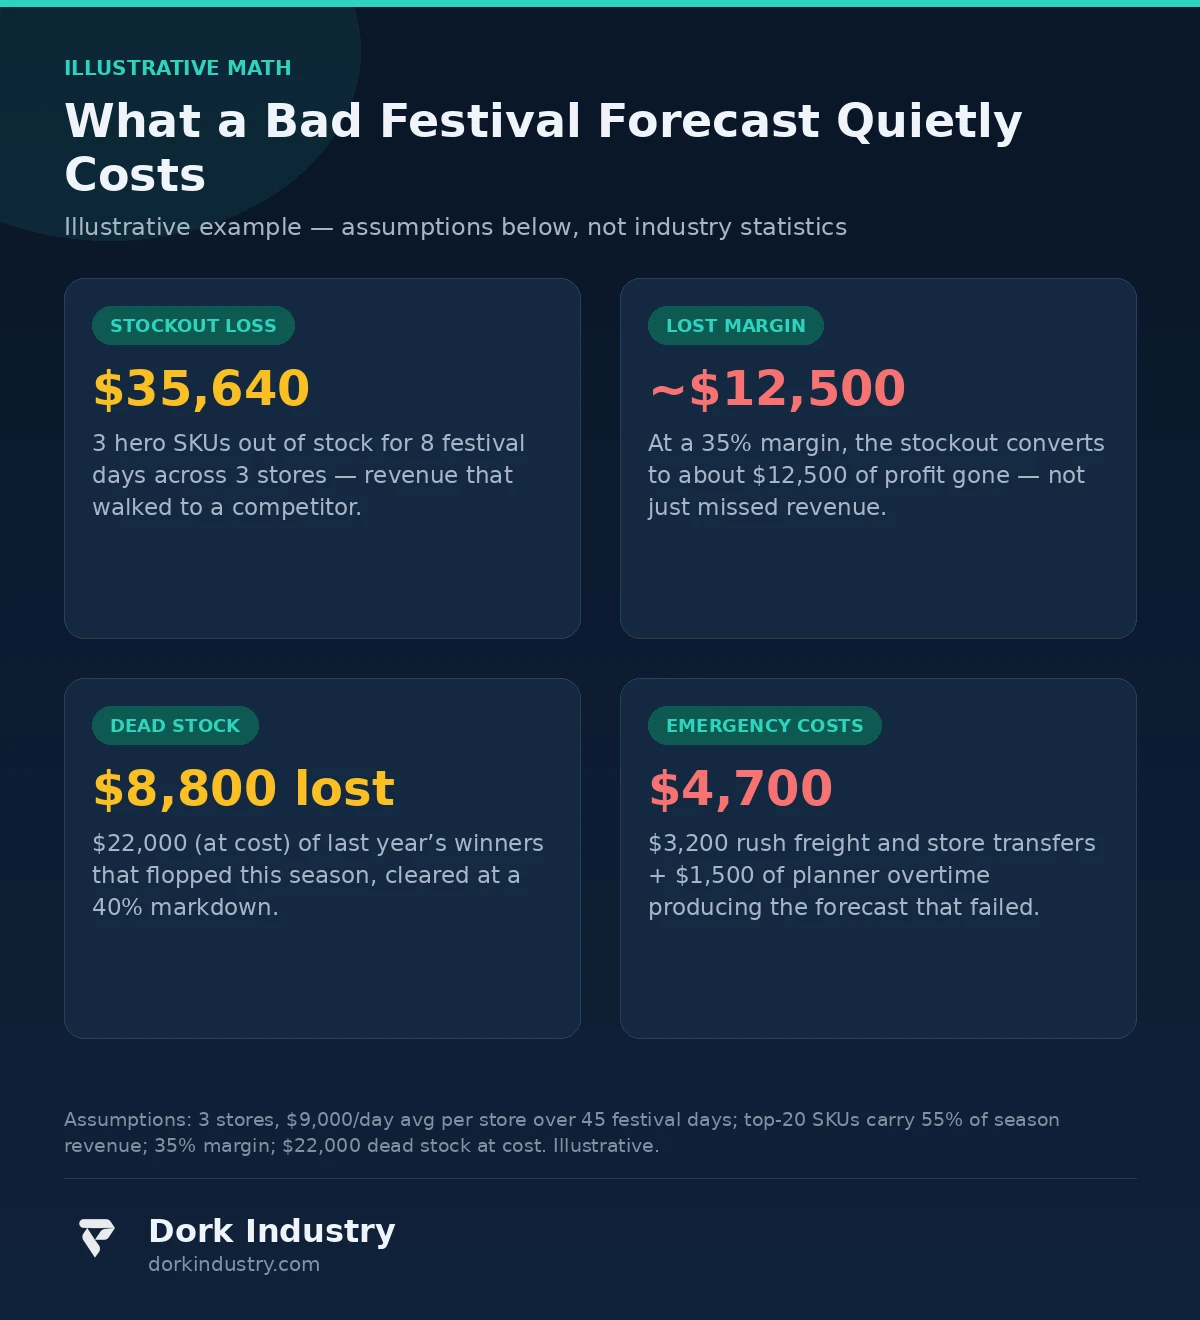
Consider the math — stated as an illustrative example with explicit assumptions, not industry statistics:
- $35,640 in lost festival revenue. Assume 3 stores, each doing $4,000/day normally and averaging $9,000/day across a 45-day festival season (a 2.25× uplift). Assume the top 20 SKUs carry 55% of season revenue, and 3 hero SKUs — roughly 30% of that hero share — stock out for 8 days. 8 days × $27,000/day across stores × 55% × 30% ≈ $35,640 of revenue that walked to a competitor. At a 35% margin, that is about $12,500 of profit gone.
- $8,800 lost on dead stock. Assume $22,000 (at cost) of last year’s “winners” that flopped this season, cleared at a 40% markdown — roughly $8,800 lost, plus the shelf space they occupied while heroes were missing.
- $3,200 in emergency logistics. Rush transfers between stores and last-minute supplier freight when the stockout is discovered mid-season — assume $3,200 for the season.
- $1,500 of planner overtime. Assume 60 hours of manual Excel reconciliation across the buying team at $25/hour — work that produced the forecast that failed anyway.
- ≈ $26,000 per season. Add the margin loss, the markdown loss, the emergency freight and the wasted labor: one bad festival forecast costs this illustrative retailer roughly $26,000 — and that is before counting the customers who never came back.
According to Meta’s Prophet documentation, the open-source forecasting library was built specifically for business time series with strong seasonal effects — the exact shape of festival-season retail data (Prophet: forecasting at scale). The season has a curve; the curve repeats; the job is to learn it properly instead of eyeballing last year’s spreadsheet.
Why does festival demand stay a gut-feel decision?
Almost every mid-size retailer already sits on two or three years of POS data. Yet the festival order is still placed on instinct and last year’s spreadsheet. Four reasons this persists:
First, last year’s numbers lie. Last year’s sales show what you sold, not what you could have sold. Every day a hero SKU was out of stock is a day of zero sales recorded as zero demand — and planners copy last year’s stockouts into this year’s order.
Second, promotion spikes masquerade as demand. A SKU that sold 400 units during a 20%-off weekend did not “grow” — it was discounted. Naive forecasts treat the spike as baseline and over-order. Separating the promotion lift from underlying demand is the single most valuable thing a forecasting model does.
Third, new SKUs have no history. Every festival brings new launches and new variants. Gut feel handles them by guessing; spreadsheets handle them by copying a “similar” SKU’s numbers and hoping. Neither is a method.
Fourth, stores hoard and headquarters guesses. Each store manager inflates their indent “just in case,” headquarters trims it by an arbitrary percentage, and the final number is a negotiation, not a forecast.
What sales data do you already own?
More than you think — AI development works best when it starts from your existing material:
- POS line items, 2–3 years. Date, SKU, store, quantity, price, discount — the raw material of every forecast.
- Promotion and markdown calendar. When each discount ran, at what depth, on which SKUs. This is what lets the model separate promo lift from real demand.
- Purchase orders and lead times. What you ordered, when it arrived, and how late it was — the constraint the forecast must respect.
- Stock-out days per SKU per store. The censored-demand record: zero sales on these days means “unknown,” not “zero.”
- Returns and exchanges. Gross sales flatter the truth; net sales after returns are what you actually needed to stock.
- E-commerce and marketplace sales. If you sell online, that demand curve belongs in the same forecast — festival shoppers check both.
The foundation of the whole system is one rule: record what would have sold, not just what sold. Every stock-out day is flagged, every promo is labeled, every return is netted.
What does AI development actually build for demand forecasting?
Here is what the system looks like in practice — no buzzwords:
SKU clustering, not 5,000 separate models. Your catalog is grouped by sales velocity and seasonality shape — hero SKUs get individual attention; the long tail is forecast at category or cluster level. One model for the whole catalog averages away exactly the differences that matter.
Seasonality decomposition. The model separates each SKU’s sales into trend, festival seasonality, weekly rhythm and promotion lift — each component estimated from your history, not assumed.
Promo-lift separation. Every past promotion is coded with its depth and duration, so the model learns “this SKU sells 2.3× at 20% off” as a rule — and forecasts the baseline separately from the promoted demand.
Per-store forecasts with transfer logic. The forecast is produced per store, then the system recommends inter-store transfers before new purchase orders — moving dead stock from a slow store to a hot one costs a fraction of a fresh order.
Cold-start for new SKUs. A new launch borrows the demand curve of its closest “sibling” SKU — same category, same price band — with a wider confidence band, instead of pretending the model knows.
Confidence bands, not single numbers. Every forecast ships with a range: “order 800–1,100 units; 950 is the expected case.” A forecast without a confidence band is a guess wearing a suit.
According to the scikit-learn documentation, the regression and ensemble methods commonly used in production forecasting — from regularized linear models to gradient boosting — are mature, well-tested tooling, not research experiments (scikit-learn: machine learning in Python). The hard part of demand forecasting was never the algorithm; it is the censored demand, the promo labeling and the SKU hierarchy.
What must the forecasting system never do alone?
This is the boundary that keeps the system trustworthy:
- Never place a purchase order above a review threshold. The system recommends quantities; the buyer confirms every order. Automation proposes, humans dispose — especially on the big festival bets.
- Never mark down or liquidate stock. Pricing and clearance authority stays with the merchandiser. The model can flag that a SKU will not sell through; only a human decides the markdown.
- Never silently overwrite a buyer’s override. When a buyer changes the model’s recommendation, the override is logged with a reason — and becomes labeled training data. A model that argues with the buyer gets unplugged.
- Never forecast with confidence on broken inputs. POS gaps, unsynced returns, missing promo records — the system flags low-confidence forecasts explicitly instead of publishing a clean-looking number built on dirty data.
- Never treat a promo spike as baseline demand. Promoted sales are always decomposed before they enter the baseline. A model that cannot tell discount-driven from organic demand will over-order after every sale event.
- Never touch customer-level data. Forecasts run on SKU-level aggregates only. There is no reason for a demand model to see individual shoppers, and no excuse for one that does.
When should you NOT build a custom forecasting model?
Honesty first: most retailers do not need a custom model on day one.
Buy when the problem is small and standard. Under ~500 SKUs, a single store, a stable assortment — off-the-shelf demand-planning modules (inside Zoho Inventory, TallyPrime, or NetSuite) handle this well, and a disciplined spreadsheet with proper promo labeling is a legitimate first step.
Build custom only when one of four things is true: you run multiple stores with inter-store transfers, your festival calendar is promo-heavy enough that lift separation matters, you carry private-label SKUs with manufacturing lead times that punish wrong bets, or your POS/ERP stack is custom enough that off-the-shelf tools cannot reach your data cleanly.
The pilot described below works either way. If the off-the-shelf tool clears your acceptance bar, you have saved yourself a custom build. If it does not, you have produced the cleansed dataset and the measured baseline that a custom build needs. Either outcome is a win.
What does a 30-day pilot look like?
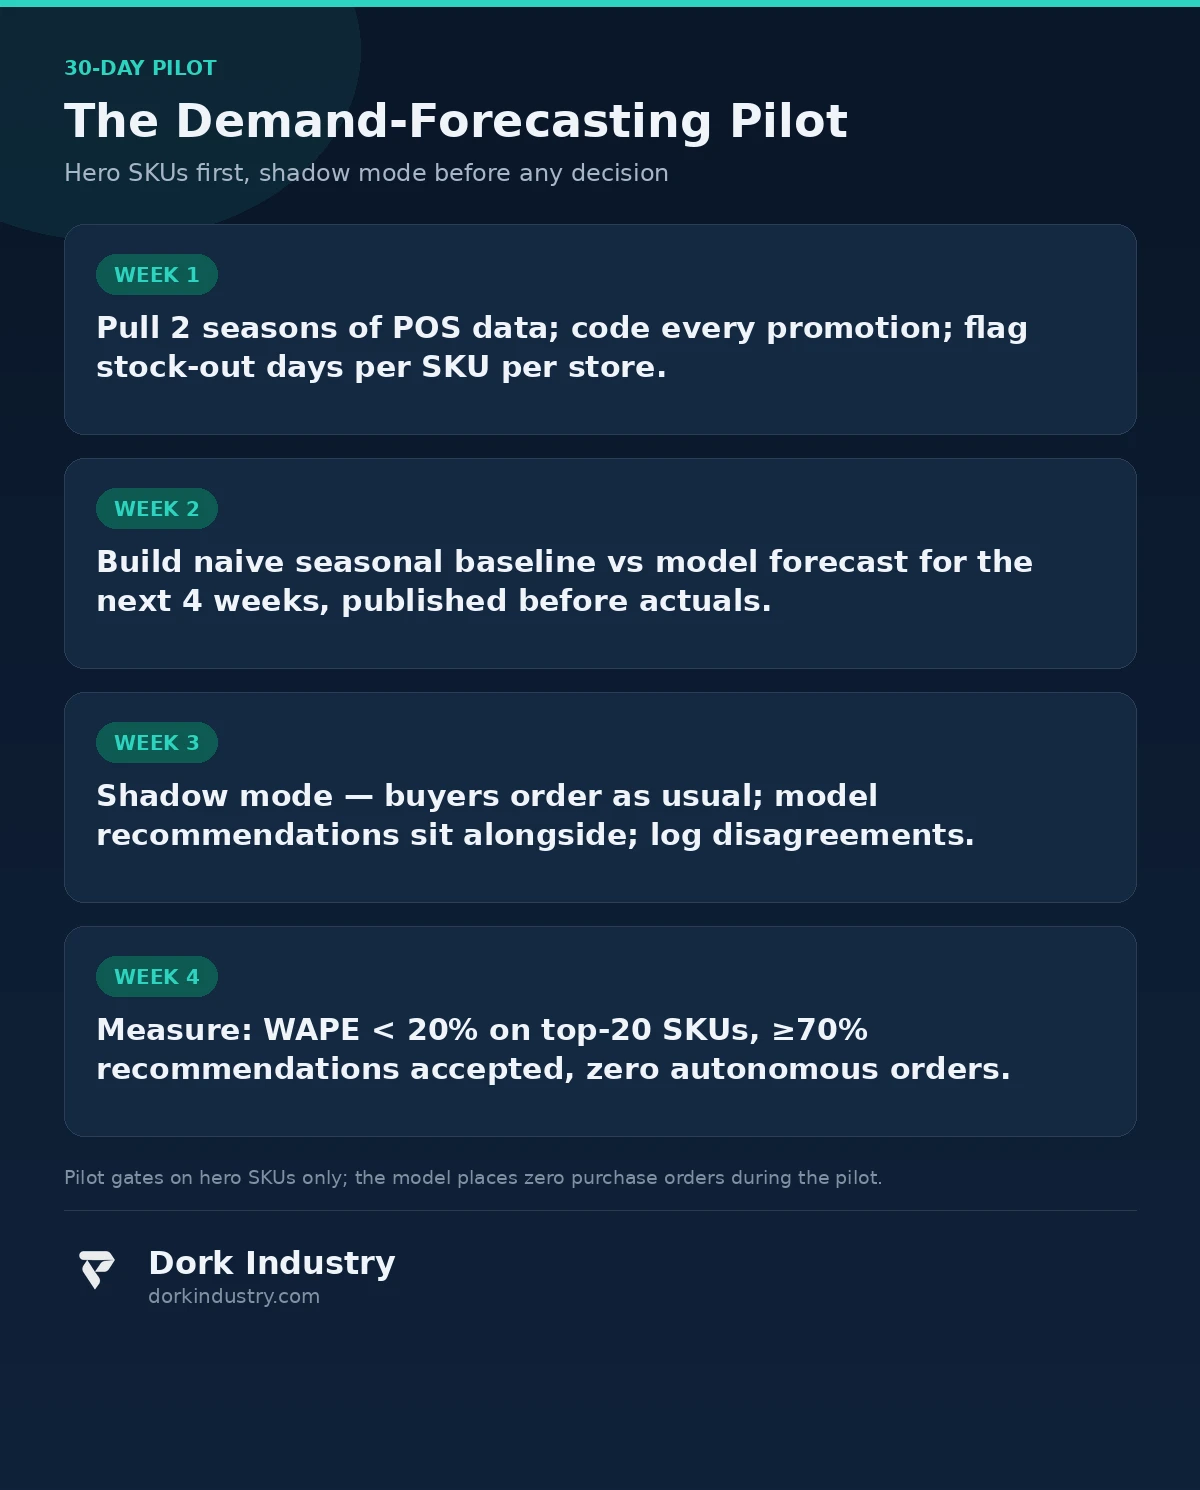
Week 1 — data pull and cleansing. Export two full seasons of POS line items, the promotion/markdown calendar, purchase orders with lead times, and returns. Flag every stock-out day per SKU per store. This is the only week that asks anything of your team beyond normal operations.
Week 2 — baseline models. Build two forecasts for the next four weeks: a naive seasonal baseline (last year’s same weeks, adjusted for growth) and the model. Publish both side by side before anyone sees the actuals. No workflow changes, no authority changes.
Week 3 — shadow mode. Buyers place their festival orders as usual, but the model’s recommendations sit next to theirs. Every disagreement is logged with the buyer’s reason. The model places zero purchase orders — it only recommends.
Week 4 — measure and decide. Three acceptance gates: WAPE (weighted absolute percentage error) under 20% on the top-20 hero SKUs, at least 70% of the model’s recommendations accepted by buyers or explained by a logged override, and zero autonomous purchase orders. Pass all three and you scale to the full catalog.
What drives the cost of a demand-forecasting build?
Five cost drivers, in rough order:
- Data cleansing and SKU mapping. Merging two seasons of POS data, coding every promotion, building the SKU hierarchy — the single biggest variable, and the part most vendors under-quote.
- Promo and markdown modeling. Separating lift from baseline across dozens of promotion types is where the modeling effort actually lives.
- POS/ERP integration. The forecast must land where orders are placed — exported into your existing purchase workflow, not a dashboard nobody opens.
- Per-store granularity. One central forecast is cheap; per-store forecasts with transfer logic multiply the pipeline work.
- Retraining cadence. A light, scheduled retrain as new seasons complete. The system decays gracefully, not catastrophically — but it does decay.
A pilot covering your hero SKUs typically runs on a fraction of a full build’s budget — the point of piloting is that you buy the measurement before you buy the system.
How do gut feel, spreadsheets and AI-assisted forecasting compare?
| Capability | Gut feel | Spreadsheet | AI-assisted forecasting |
|---|---|---|---|
| Forecast basis | Buyer’s memory | Last year’s sales | Decomposed demand (trend + seasonality + promo) |
| Hero-SKU accuracy | Varies by buyer | Copies last year’s stockouts | Measured WAPE, improving each season |
| Promotion handling | Guesswork | Spikes treated as baseline | Lift separated from baseline demand |
| Stock-out days | Forgotten | Zero sales = zero demand | Flagged as censored demand |
| New SKUs | Pure guess | Copy a “similar” SKU | Cold-start from sibling SKU + wide confidence band |
| Per-store granularity | One number, negotiated | Store splits by ratio | Per-store forecast + transfer recommendations |
| Who decides the order | Buyer | Buyer | Buyer — model only recommends |
The bottom line
Your POS system already recorded two or three festival seasons — the demand curve is in there, buried under promotion spikes, stock-out gaps and un-netted returns. AI development extracts that curve, separates the promo lift from real demand, and recommends per-store order quantities with an honest confidence band — while your buyers keep every decision that matters.
Still ordering festival stock on last year’s gut feel?
Send Dork Industry two seasons of your POS data. We will build a shadow forecast for your hero SKUs, show you exactly where gut feel and the data disagree, and design the 30-day pilot for your stores — before this season’s purchase orders go out.
Request a free demand-forecasting assessment WhatsApp +91 8210792477
About Dork Industry
Dork Industry (dorkindustry.com) is a custom software development company building mobile apps, AI automation, and IoT systems for businesses across India. Our team designs demand-forecasting pipelines, inventory analytics and replenishment workflows — from 30-day forecasting pilots to full multi-store planning platforms, with the same discipline we apply to AI automation for business processes and custom software development for retail.
Frequently asked questions
Can AI development forecast demand with only one year of sales data?
Partially. One year gives the model one observation of each season — enough for a first shadow forecast with wide confidence bands, but not enough to separate trend from noise. Two to three seasons is the practical minimum for festival forecasting.
Will demand forecasting replace our purchase manager?
No — and the system is explicitly designed not to. The model recommends order quantities with confidence bands; the buyer confirms every purchase order and every override is logged as training data. What changes is the ratio: buyers spend their judgment on exceptions and new SKUs instead of spreadsheet arithmetic.
What if our POS data is messy — missing promos, unsynced returns?
Then the pilot’s first deliverable is the cleansing itself, and the model flags low-confidence forecasts instead of publishing clean-looking numbers. Most retailers are surprised how much signal survives: even imperfect POS data with coded promotions usually beats last-year-copying on hero SKUs.
How accurate can festival demand forecasting get?
On hero SKUs with two-plus seasons of cleansed history, a WAPE under 20% is a realistic pilot gate — meaning the forecast is within a fifth of actual demand on the SKUs that matter most. The long tail will always be noisier; that is why the pilot gates on the top 20, not the whole catalog.
How does the model handle one-off disruptions — a new store, roadworks, a competitor opening nearby?
It flags them as out-of-model events rather than learning the wrong lesson. One-off disruptions get a manual adjustment layer from the buyer, logged with a reason, instead of contaminating the seasonal curve. A model that cannot say “this event is not in my training data” is a model you should not trust.