
Overview
A multi-outlet fuel retail network operating 42 petrol pump stations across urban and highway locations was running standard dispensing units integrated with basic mechanical and electronic sensors — flow meters, nozzle switches, tank level sensors, pressure sensors, and motor current sensors. While the hardware functioned adequately under normal conditions, station managers had no proactive way to detect emerging issues — flow meter drift, sensor miscalibration, wiring faults, or pump motor irregularities — before they caused revenue leakage, customer disputes, or safety incidents.
The client engaged our team to design and deploy a software layer that continuously reads live data from pump hardware/sensors, applies anomaly detection and root-cause logic, and either auto-corrects minor issues or alerts staff/technicians in real time — shifting the operation from reactive repair to proactive, data-driven maintenance.
Project scope:
- 42 stations, 168 individual dispensing units (avg. 4 nozzles/pumps per station)
- Mixed hardware environment: 3 different pump OEM brands, 2 generations of controllers
- Timeline: 14 weeks development + rollout, plus 30-day hypercare
- Team: 2 backend engineers, 1 embedded/IoT engineer, 1 data scientist, 1 QA engineer, 1 project manager
Key stakeholders:
- Station owners/franchise operators (business continuity, revenue protection)
- On-site attendants (first responders to alerts)
- Maintenance/technician team (root-cause diagnosis, repairs)
- Regional operations manager (network-wide visibility)
- Compliance officer (weights & measures audit readiness)
The Challenge
The client came to us with a set of recurring, costly problems, all traced back to a gap between what the hardware/sensors were reporting and what software intelligence existed to interpret that data.
1. Flow Meter Inaccuracy (Quantity Disputes)
Mechanical/electronic flow sensors (positive displacement + pulse transmitter type) drifted over time due to internal component wear, temperature fluctuation, and fuel viscosity changes. This caused dispensed volume to deviate from the displayed/billed reading by 1–3% on affected units — enough to trigger customer disputes and put the client at risk under weights & measures regulations.
- No systematic way to know which dispensers were drifting without manual test-can calibration (a slow, once-a-month manual process).
- Drift was often gradual, so it went unnoticed for weeks.
2. Nozzle Sensor False Triggers
Nozzle-in/nozzle-out microswitches and hall-effect sensors occasionally misfired due to:
- Vibration from heavy vehicle traffic near the forecourt
- Loose or corroded wiring at the nozzle holster
- Dust/moisture ingress in older units
This caused pumps to fail to start, fail to stop, or register a phantom transaction — leading to spillage risk, customer frustration, and occasional revenue leakage from unbilled dispensing.
3. Tank Level Sensor Errors
Ultrasonic and float-based level sensors gave incorrect readings due to:
- Sensor fouling (residue buildup on ultrasonic sensor face)
- Float sensor mechanical sticking
- Signal noise from nearby electrical equipment
Result: false “stock-out” alerts (triggering unnecessary emergency refill orders) or missed low-stock windows (risking actual stock-outs during peak hours).
4. Pressure/Motor Sensor Anomalies
Pressure sensors on the fuel line and motor current sensors on the submersible pump motor occasionally showed irregular spikes or gradual drift — early indicators of:
- Line blockages or filter clogging
- Motor bearing wear
- Impending seal failure
However, there was no software correlating these signals with likely causes, so staff only became aware after a full pump failure or motor burnout.
5. No Centralized Diagnostics
Every sensor-related issue required an on-site technician visit just to identify the fault, since there was no dashboard correlating hardware signals with probable fault types across the network. Average technician response + diagnosis time was 2–3 hours, on top of repair time.
6. No Historical Fault Data
Without systematic logging, recurring faults on the same nozzle/dispenser unit went unnoticed until they escalated into major failures — meaning the same low-grade issue (e.g., a loose connector) could cause 3–4 repeat incidents before being properly fixed.
Quantified Business Impact (Pre-Solution)
| Issue Area | Impact |
|---|---|
| Flow inaccuracy revenue loss | 5–8% of fuel-value throughput on affected dispensers |
| Average unplanned downtime | 4–6 hours per incident, ~14 incidents/month network-wide |
| Customer complaints (quantity disputes) | ~25–30 per month across network |
| Emergency technician call-outs | ~18/month, at premium out-of-hours rates |
| Compliance audit prep time | 3–4 days per audit cycle (manual log compilation) |
| Estimated annual cost of the above | Client-estimated ₹85–95 lakh (~$100K–115K) in lost revenue + repair costs |
Solution
We designed and built SmartPump AI, a sensor-integrated pump monitoring and diagnostic software system, with the following features:
1. Real-Time Sensor Data Ingestion
- Continuous polling (500ms–1s interval, configurable per sensor type) from flow meters, nozzle switches, level sensors, pressure sensors, and motor current sensors.
- Integration via existing pump controller interfaces using RS-232, RS-485, and Modbus RTU/TCP protocols, plus a custom adapter built for one legacy OEM controller that used a proprietary serial protocol.
- A normalization layer converts all sensor brands/models into a unified internal data schema, so the detection engine works identically regardless of hardware vendor.
- Local buffering (edge device stores up to 72 hours of data) to prevent data loss during connectivity gaps.
2. Anomaly Detection Engine
Combines rule-based thresholds with statistical pattern detection:
- Flow rate deviation detection: Compares real-time pulse-count-to-volume ratio against a per-dispenser calibrated baseline; flags deviations beyond ±0.5% (warning) and ±1.5% (critical).
- Nozzle sensor bounce detection: Uses a debounce + frequency-analysis algorithm to distinguish genuine nozzle events from electrical noise/false triggers; flags a unit if false-trigger rate exceeds a rolling 24-hour threshold.
- Tank level consistency checks: Cross-validates level sensor readings against expected depletion rate (calculated from dispensed volume logs) to catch sensor faults vs. genuine stock changes.
- Pressure/motor correlation model: A lightweight regression model trained on historical fault-and-repair data correlates pressure/current signatures with likely root causes (e.g., gradual pressure drop + rising motor current = filter clogging; sudden pressure spike = line blockage).
- Root-cause suggestion engine: Outputs a ranked list of probable causes with confidence scores (e.g., “78% — flow meter recalibration needed,” “15% — wiring fault at pulse transmitter”).
3. Auto-Correction & Fail-Safe Logic
- Minor, known-pattern issues (e.g., small flow calibration offset within ±1%): software applies a temporary digital correction factor to the billing calculation while flagging the unit for technician recalibration — ensuring customers are billed accurately even before a physical fix.
- Safety-critical anomalies (nozzle stuck open, pressure spike beyond safe threshold, motor current indicating imminent failure): system automatically halts the dispensing unit and locks it out until a technician clears the fault — preventing spillage, fire risk, or equipment damage.
- All auto-corrections are capped within pre-approved tolerance bands set by the client’s compliance team; anything beyond that always requires human confirmation before any correction is applied — this was a non-negotiable safety/compliance guardrail agreed with the client upfront.
- Every auto-correction event is logged immutably for audit purposes.
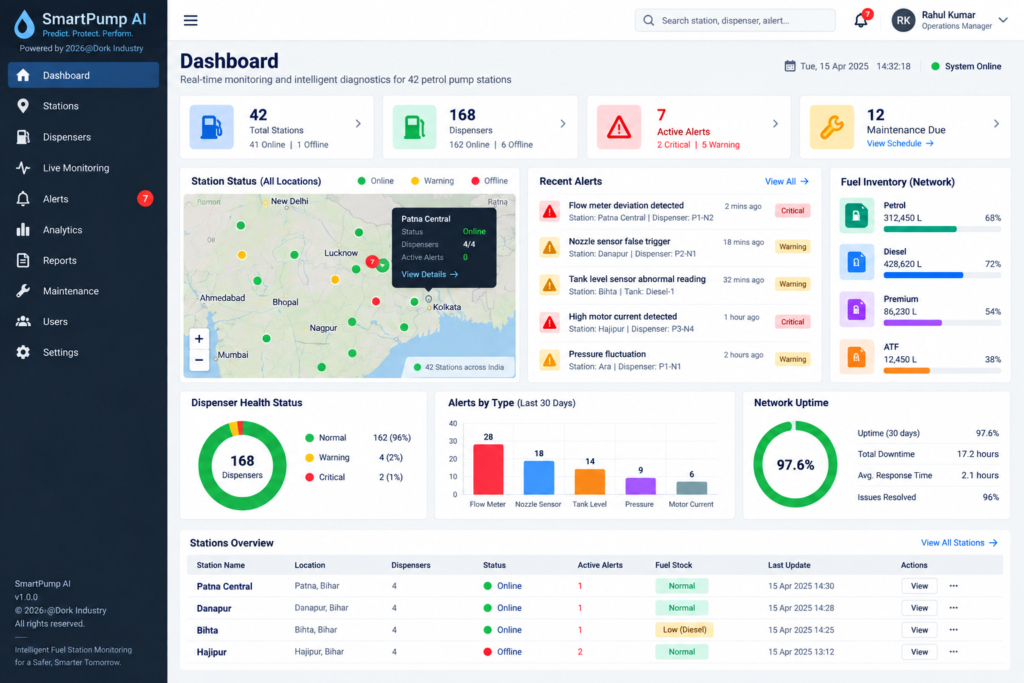
4. Real-Time Alerts & Dashboard
- Live network dashboard: pump-by-pump health status shown as Green (normal) / Yellow (minor issue, scheduled maintenance) / Red (critical, unit halted).
- Instant notifications via SMS and mobile app push to on-duty attendants and on-call technicians, with severity-based routing (critical alerts go to both on-site staff and regional technician on-call rotation simultaneously).
- Drill-down views per dispenser: live sensor readings, recent fault history, suggested root cause, and one-tap “acknowledge/escalate” actions for attendants.
5. Historical Logging & Predictive Maintenance
- All sensor readings and fault events stored with timestamps in a time-series database for trend analysis.
- Predictive maintenance scoring: each sensor/component gets a rolling health score based on drift trends, false-trigger frequency, and historical failure patterns — flagging components likely to fail in the next 2–4 weeks for proactive replacement.
- Monthly automated reports to regional managers summarizing fleet-wide health trends.
6. Compliance & Audit Reporting
- Automated calibration logs, correction-factor history, and fault-resolution records generated in exportable formats for weights & measures inspections.
- One-click audit report generation, replacing the previous 3–4 day manual compilation process.
Implementation
Phase 1: Assessment & Sensor Mapping (Weeks 1–2)
- Audited hardware across all 42 stations: catalogued 3 pump OEM brands, 2 controller generations, and sensor types/models per station.
- Identified data points available natively from each sensor and gaps requiring additional hardware — added low-cost auxiliary current sensors on 9 older units that lacked motor monitoring.
- Documented all communication protocols in use (mostly Modbus RTU, one legacy proprietary protocol requiring a custom adapter).
Phase 2: Software Architecture Design (Weeks 3–4)
Built a modular, three-layer architecture:
- Edge layer: A local device (Raspberry Pi–class industrial gateway) at each station reads sensor data, runs basic sanity checks, and buffers data locally.
- Processing layer: Runs the anomaly detection engine, root-cause model, and auto-correction logic — designed to run locally at the edge, not dependent on cloud connectivity, so critical fail-safes (like halting a leaking nozzle) work even during internet outages.
- Cloud/dashboard layer: Aggregates data from all 42 stations for network-wide visibility, historical analytics, and predictive maintenance scoring.
This local-first design was a deliberate architectural decision: safety-critical logic (shutting down a hazardous unit) must never depend on internet connectivity.
Phase 3: Development & Sensor Calibration Logic (Weeks 5–8)
- Developed the anomaly detection engine using 18 months of historical fault/repair data provided by the client to set accurate per-sensor-type thresholds.
- Built the auto-correction module with the safety guardrails described above.
- Integrated SMS gateway and mobile push notification services.
- Built the root-cause correlation model using a combination of rule-based logic (for well-understood fault patterns) and a lightweight ML classifier (trained on the historical dataset) for less obvious correlations.
Phase 4: Pilot Testing (Weeks 9–10)
- Deployed at 3 pilot stations representing each of the 3 hardware brands in the network.
- Ran parallel monitoring (manual technician checks + software detection) for 2 weeks to validate detection accuracy against real findings.
- Initial pilot results: 91% detection accuracy, with a false-positive rate of ~12% — refined thresholds over the pilot period to bring false positives down to ~4% by end of pilot.
Phase 5: Full Rollout & Training (Weeks 11–14)
- Rolled out across all 42 outlets in batches of ~10 stations/week to manage support load.
- Trained attendants (2-hour session per station) on reading dashboard alerts, acknowledging notifications, and basic first-response actions (e.g., what to do when a unit auto-halts).
- Trained the technician team (full-day workshop) on using historical logs, root-cause suggestions, and predictive maintenance scheduling.
Phase 6: Post-Launch Support
- 30-day hypercare period with daily monitoring of detection accuracy and manual review of every auto-correction event.
- Ongoing threshold tuning for seasonal/environmental factors (e.g., temperature affecting flow sensor readings in summer months, humidity affecting ultrasonic level sensors during monsoon).
- Established a monthly model-retraining cadence to keep the root-cause correlation model accurate as new fault patterns are logged.
Results / Outcome
Quantitative Results (First 3 Months Post-Rollout)
| Metric | Before | After | Improvement |
|---|---|---|---|
| Average pump downtime per incident | 4–6 hours | 45–60 minutes | ~85% reduction |
| Flow inaccuracy-related revenue loss | 5–8% | <1.5% | ~80% reduction |
| Customer quantity-dispute complaints | ~25–30/month | ~4–5/month | ~83% reduction |
| Fault detection timing | Reactive (post-failure) | Real-time (pre-failure) | Near-instant detection |
| Emergency technician call-outs | ~18/month | ~7/month | ~61% reduction |
| False-positive alert rate | N/A (no system) | ~4% (post-tuning) | High detection confidence |
| Compliance audit prep time | 3–4 days | Same-day (automated) | ~90% time reduction |
| Preventable mid-shift failures avoided | — | 12+ in Q1 | Proactive replacements |
Financial Impact
- Estimated annual savings of ₹55–65 lakh (~$65K–78K) from reduced revenue leakage, lower emergency repair costs, and reduced downtime-related lost sales.
- Payback period on the software + auxiliary hardware investment: approximately 5 months.
Operational & Qualitative Outcomes
- Station managers gained a single-pane-of-glass view of pump health across the entire 42-station network, enabling better staffing and maintenance scheduling.
- Predictive maintenance flags allowed proactive replacement of aging sensors, avoiding an estimated 12+ potential mid-shift pump failures in the first quarter alone.
- Improved customer trust due to fewer quantity disputes and faster fault resolution.
- Technicians reported that root-cause suggestions cut their on-site diagnosis time by roughly half, since they arrived already knowing the likely fault area.
- Compliance team reported audit readiness improved from a multi-day scramble to an on-demand report.
Client Feedback
The client reported that SmartPump AI turned reactive hardware firefighting into proactive, data-driven maintenance — reducing both operational costs and customer-facing incidents within the first three months of full deployment, and giving regional management visibility they previously didn’t have across a geographically spread-out network.
Future Roadmap (Discussed with Client)
- Expanding the predictive model with more granular component-level failure prediction (e.g., specific seal/bearing wear curves).
- Adding a customer-facing transparency feature showing real-time calibration status per dispenser as a trust-building measure.
- Extending the platform to new stations as the client’s network grows, with a target of full onboarding within 48 hours per new station using the now-standardized edge device setup.