
Computer vision in manufacturing is a camera-based inspection and decision system that creates value when it prevents a measurable defect, delay or unsafe condition without slowing the line. Indian plants should require representative production images, defect-level recall, false-reject limits, cycle-time evidence, offline recovery, traceability and a signed financial baseline before approving deployment.
What are the key takeaways?
- Start with one expensive visual decision, not a general request to “add AI” to the factory.
- Measure missed defects and false rejects separately for every critical defect class.
- Test the complete path from camera exposure to PLC action at actual line speed.
- Keep uncertain cases reviewable and define what happens when the camera, edge computer or network fails.
- Calculate value from verified baseline losses and production evidence, not vendor accuracy alone.
What is computer vision in manufacturing?
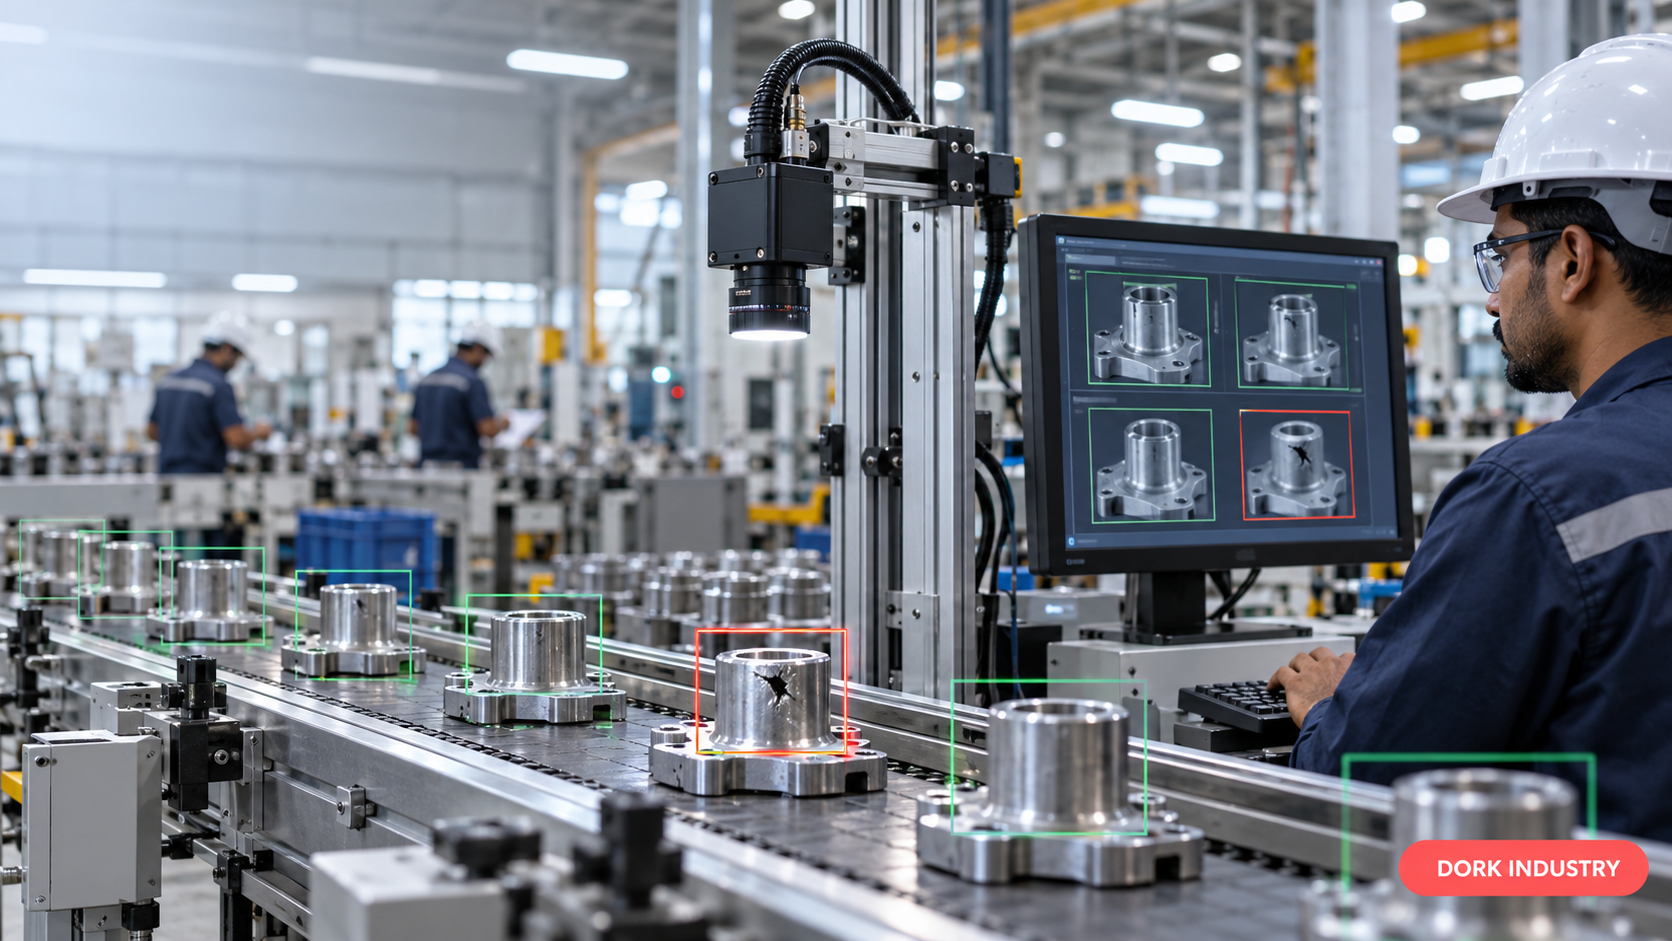
Computer vision in manufacturing uses cameras, controlled lighting and software models to interpret visual production data. It can inspect a part, verify an assembly step, read a code, detect a safety condition or track material flow. The output becomes useful only when it triggers a defined action such as reject, stop, route to review, record evidence or notify an operator.
A complete system is therefore more than a model. It includes the imaging station, edge or server compute, decision thresholds, PLC or machine interface, MES or quality integration, evidence storage, operator workflow, monitoring and change control. A weak component anywhere in that chain can erase the benefit of a strong model.
When is a vision system a good business fit?
It is a strong candidate when the current decision is visual, repetitive, time-sensitive and costly when wrong. The plant must also be able to control how the product is presented to the camera. Variable lighting, hidden surfaces, oil, dust, vibration, mixed variants and unlabelled defects do not make a project impossible, but they must appear in the pilot data.
When should a plant not begin with AI?
Do not begin with AI when the failure is caused by an unstable upstream process, an inconsistent fixture, missing work instructions or a sensor that could measure the requirement more directly. Fixing presentation and process control may deliver value faster. Computer vision should observe a defined standard, not compensate indefinitely for an undefined one.
Which computer vision use cases matter most in Indian manufacturing?
The highest-value use case depends on the cost of a wrong decision. The following matrix connects common Indian manufacturing workflows to the evidence a buyer should demand.
| Workflow | What vision checks | Business evidence | Common trap |
|---|---|---|---|
| Auto components | Surface damage, dimensions, missing features and assembly orientation | Customer returns, line rejection, rework minutes and containment cost | Testing only clean samples from one shift |
| Electronics and solar | Solder, connector, cell, label and polarity defects | First-pass yield, warranty failures and test escape rate | Ignoring glare and small-defect resolution |
| Pharma and cosmetics | Fill, seal, cap, code, leaflet and packaging verification | Batch review time, rework and traceability exceptions | Treating a model result as the sole compliance record |
| Food and FMCG | Pack integrity, fill level, contamination cues, labels and dates | Giveaway, complaint, recall and reinspection cost | Missing product and packaging changeovers |
| Textiles and footwear | Weave, shade, stitching, print placement and component presence | Grade loss, rework and buyer rejection | One threshold across materials and colours |
| Metal, glass and stone | Cracks, pits, inclusions, edge damage and surface finish | Scrap, downgraded output and downstream processing waste | Not validating heat, dust, vibration and reflections |
| Warehouse and intralogistics | Barcode/OCR, pallet condition, count, location and loading events | Mis-picks, reconciliation time and dispatch disputes | Automating without exception reconciliation |
| Worker safety | Restricted-zone entry, PPE or unsafe proximity | Response time and verified hazardous events | Using face identification where anonymous event detection is sufficient |
Safety analytics can assist detection, but it must not replace guarding, interlocks, training or statutory controls. When identifiable workers appear in footage, involve privacy, HR and legal owners before deciding what is captured, retained or used. India’s Digital Personal Data Protection Act, 2023 provides the legal framework; project-specific obligations require qualified advice.
Which nine ROI tests should a computer vision project pass?
These tests convert a demonstration into a production decision. A plant may change the target values, but it should not skip the evidence.
1. Does the project have a measured loss baseline?
Choose one decision point and measure its current volume, labour, defect leakage, false rejection, rework, scrap, downtime and complaint cost. Record who owns each number and how it was calculated. “Inspection is slow” is not a baseline; “two inspectors review 4,800 units per shift, while 0.6% require downstream containment” can be tested.
2. Can the camera consistently see the required evidence?
Validate field of view, working distance, resolution, shutter, lens, lighting and part presentation before model training. Include worst-case speed, vibration, ambient-light change, dust and reflective surfaces. If a critical defect occupies too few usable pixels or remains hidden, more training data will not repair the imaging geometry.
3. Does the dataset represent production variation?
Build the evaluation set from different shifts, machines, suppliers, materials, operators, lots and seasons where relevant. Separate it from training data. Label normal, borderline and defect examples with the quality team, and keep disagreement visible. Rare defects may require staged examples, controlled seeding or a hybrid anomaly-detection approach, but synthetic examples must never be presented as observed field frequency.
4. Does quality hold for every critical defect class?
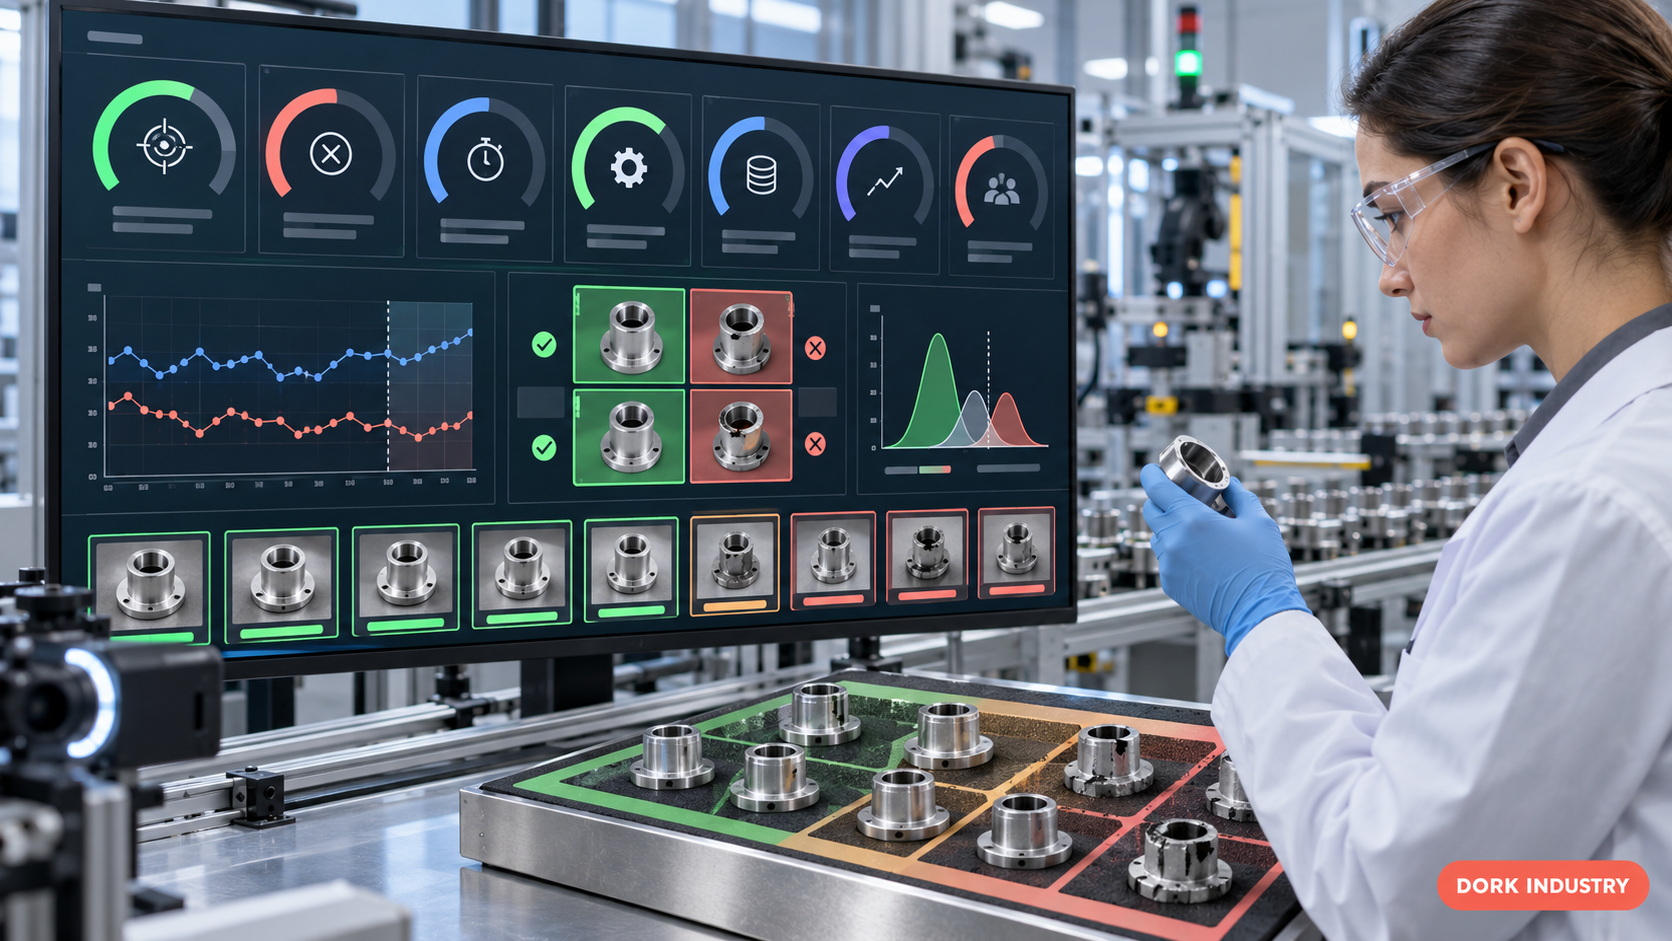
Report a confusion matrix and class-level recall, precision and false-reject rate. Overall accuracy can hide a model that performs well on abundant normal parts and misses a rare critical defect. Define the economic and safety consequence of a false accept and a false reject separately; the acceptable threshold is rarely identical.
5. Can the full system keep up with line speed?
Measure exposure, transfer, preprocessing, inference, decision, PLC communication and actuator delay as one path. Test sustained throughput and the slowest expected case, not only average inference time. Confirm whether the reject mechanism can still isolate the correct unit after conveyor movement and whether timing remains stable during shift change or network congestion.
6. What happens to uncertain or novel cases?
Create a review band between automatic accept and automatic reject. Preserve the image, model version, score, product context and final human decision. Review load is an operating cost, so measure it. A system that sends half the line to people may be technically accurate but economically unusable.
7. Does the station fail safely and recover cleanly?
Disconnect the camera, lighting controller, edge computer, PLC link, MES link and plant network during testing. Define whether production stops, diverts, continues under manual inspection or stores records locally. Confirm health checks, time synchronisation, capacity limits, restart sequence, backup configuration and an auditable bypass process.
8. Can every decision be traced and reconciled?
Link the result to the correct part, batch, work order or timestamp. Store only the evidence needed for the defined purpose and retention period. Reconcile vision counts with PLC and MES counts so dropped or duplicate events are visible. Version the model, thresholds, recipes and camera settings together; otherwise a later audit cannot reproduce the decision.
9. Does the verified value exceed total operating cost?
Include cameras, optics, lighting, enclosure, fixtures, edge compute, networking, integration, labelling, validation, training, licences, monitoring, support, spares and model maintenance. Compare that total with verified avoided loss. Approve scale only after the pilot meets quality, throughput, reliability and financial gates simultaneously.
How should the camera, edge, PLC and MES architecture work?
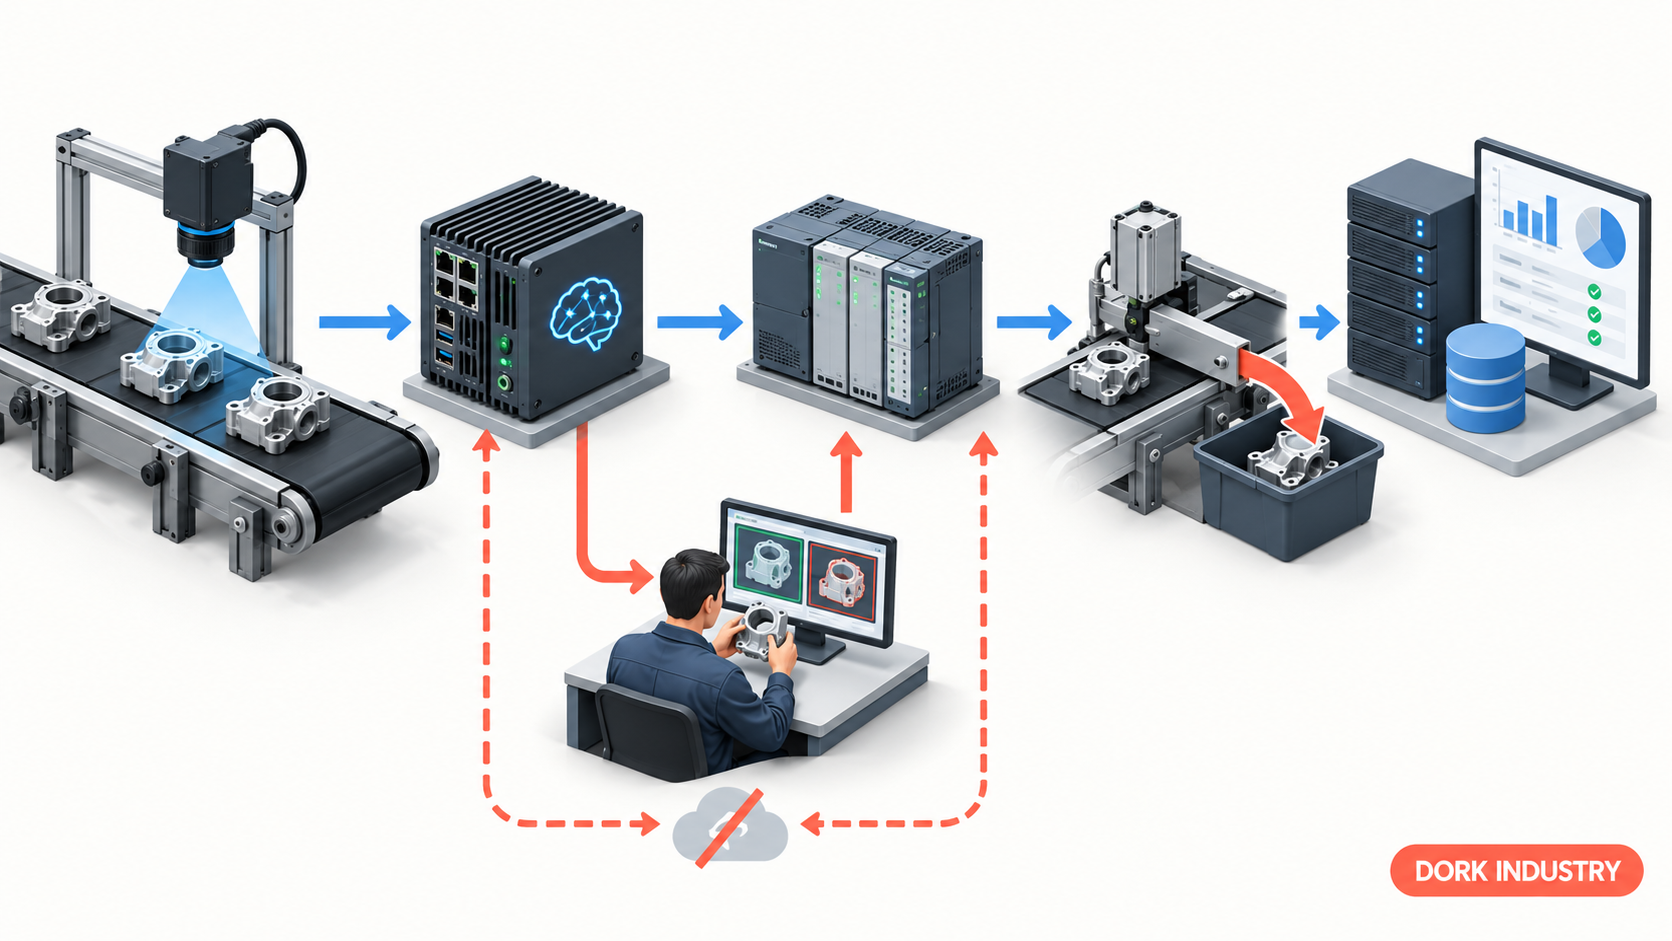
A practical design keeps time-critical decisions near the line. The camera and lighting create a consistent image; edge compute preprocesses it and runs inference; a rules layer converts model output into accept, reject or review; the PLC or machine controller performs the physical action. MES, QMS or data platforms receive traceability and aggregated performance records.
When should inference run at the edge?
Edge inference is usually preferable when the decision must happen within the production cycle, connectivity is unreliable, bandwidth is limited or raw images should remain on site. Cloud services may still support fleet monitoring, model management, approved retraining or cross-plant analytics. The choice should be based on latency, data boundaries, maintainability and cost rather than a blanket edge-or-cloud rule.
NVIDIA DeepStream documents a multi-sensor streaming toolkit that can run from edge to cloud, while the OpenVINO 2026 documentation describes inference devices and modes across supported hardware. These are implementation options, not proof that a particular plant workload will meet its cycle time; benchmark with the intended camera stream, model and hardware.
Which production controls belong around the model?
- Recipe control for product variants, cameras, thresholds and PLC mappings.
- Role-based access for bypass, threshold change, relabelling and model release.
- Signed release records and rollback to a known-good model and configuration.
- Health monitoring for image quality, lighting, device temperature, queues and storage.
- Drift review based on production outcomes, not merely a changing confidence average.
- Retention, masking and access rules for images that may contain people or sensitive process details.
According to the NIST AI Risk Management Framework, AI risk work can be organised around Govern, Map, Measure and Manage. Indian organisations can also review the Bureau of Indian Standards adoption of IS/ISO/IEC 42001:2023 when designing an AI management system and documented controls.
How can an Indian manufacturer run an eight-week pilot?
- Week 1 — diagnose: select one visual decision, process owner, baseline and financial consequence.
- Week 2 — image: validate camera, lens, lighting, fixture and line timing with representative parts.
- Weeks 3–4 — prepare: label a versioned dataset, document defect definitions and reserve an unseen evaluation set.
- Weeks 5–6 — integrate: implement inference, decision rules, PLC/MES events, review queue, logs and offline behaviour.
- Week 7 — challenge: test every defect class, variants, environmental extremes, failures, recovery and unauthorised changes.
- Week 8 — decide: compare the signed scorecard with the baseline and choose scale, revise or stop.
Which acceptance metrics belong on the scorecard?
| Metric | How to measure it | Why it matters |
|---|---|---|
| Critical-defect recall | Detected critical defects ÷ all verified critical defects | Shows dangerous or expensive escapes |
| False-reject rate | Good units wrongly rejected ÷ all verified good units | Shows avoidable rework and lost capacity |
| Decision latency | Capture-to-PLC action, including the slowest tested case | Proves fit at line speed |
| Station availability | Ready time ÷ scheduled production time, with reason codes | Exposes operational fragility |
| Manual-review rate | Review cases ÷ total inspected units | Quantifies continuing labour |
| Traceability completeness | Reconciled decisions ÷ expected PLC/MES events | Finds missing and duplicate records |
| Recovery time | Failure injection to controlled return to service | Tests supportability |
| Net value per month | Verified avoided loss minus recurring operating cost | Supports the scale decision |
Do not copy target percentages from another factory. Set them from process risk, customer requirements, current measurement capability and the cost of each error. Report the evaluation-set size and confidence limits where statistically appropriate.
How should a plant calculate computer vision ROI?
Use a transparent planning model:
Monthly net value = avoided defect leakage + avoided scrap/rework + recovered productive minutes + avoided verification labour + quantified risk reduction − recurring operating cost.
Simple break-even months = one-time deployment cost ÷ verified monthly net value.
This is a decision formula, not a Dork Industry performance claim. Populate it with finance-approved baseline data and pilot evidence. Keep soft benefits separate unless they have a documented valuation method.
Which costs are often omitted?
- Line stoppage and engineering time for installation or changeover validation.
- Rare-defect collection, annotation review and quality-team participation.
- Industrial enclosures, cleaning, calibration, lighting replacement and spare devices.
- PLC, MES, QMS, ERP and identity integration.
- Monitoring, patching, incident support, model updates and periodic revalidation.
- Manual review and containment while the system is unavailable.
What should a computer vision vendor proposal include?
- The exact decision, variants, defects, exclusions and operating environment.
- Camera, lens, lighting, fixture and compute bill of materials with replaceable equivalents.
- Dataset ownership, labelling method, evaluation split and rights to images, labels and models.
- Class-level acceptance targets, sample sizes, line-speed test and failure-injection plan.
- PLC/MES interfaces, event schema, reconciliation and responsibility for incorrect actuation.
- Offline mode, bypass approval, health monitoring, spares, response times and recovery procedure.
- Model/configuration versioning, audit trail, retraining trigger and rollback process.
- Itemised one-time and recurring costs, licence limits, cloud charges and exit terms.
Dork Industry’s industrial computer vision services cover imaging, edge AI, PLC/MES integration and controlled validation. Plants that also need equipment signals can connect the project to industrial IoT downtime tracking; keep the vision decision and the equipment-performance use case as separate acceptance scopes.
Frequently asked questions
How much does computer vision in manufacturing cost in India?
Cost depends on the number of stations, cameras, optics, lighting, fixtures, edge hardware, defect complexity, integration, validation and support. Ask for an itemised pilot and production estimate. Separate reusable engineering from per-line hardware and recurring licences so expansion economics remain visible.
How much production data is needed?
There is no reliable universal image count. Data must cover every critical defect, product variant and operating condition. The required sample depends on task complexity and acceptable uncertainty. Freeze an unseen evaluation set and report results by defect class instead of promising success from a headline dataset size.
Can computer vision replace manual quality inspectors?
It can automate repeatable checks, but many deployments still need people for borderline cases, root-cause analysis, calibration, containment and process improvement. The safer objective is a controlled division of work: machines apply consistent checks at speed, while authorised people resolve uncertainty and own quality decisions.
Should a manufacturing vision system use edge or cloud AI?
Use edge inference for time-critical control, poor connectivity, high video bandwidth or local data requirements. Use cloud components for approved fleet analytics, model operations or central reporting when appropriate. Many plants need a hybrid design with local decisions and carefully governed central management.
How should model drift be detected?
Monitor input-image quality, product mix, defect distribution, review outcomes and verified production results. A confidence shift alone does not prove drift. Trigger investigation when controlled indicators cross agreed limits, then revalidate any new model or threshold on a versioned evaluation set before release.
What happens when the network goes down?
The production response must be designed before deployment. A station may continue locally, buffer traceability events, divert units or switch to manual inspection. Test storage limits, event ordering, duplicate prevention, reconciliation and operator instructions so recovery does not create untraceable product.
How long should a computer vision pilot run?
A narrow end-to-end pilot can often be executed in roughly eight weeks after access and samples are ready. Calendar time matters less than coverage. The evaluation must include representative shifts, variants, defects, environmental conditions, failures and recovery before a scale decision is credible.
Discuss this for your business?
Book a free consultation — we scope the problem, outline the approach, and give you an honest verdict before any development is discussed.

[…] Theme code rarely controls the core hosted payment-method list, but custom carts, checkout extensions, payment customizations and apps can influence the journey or eligibility. If the cart itself is broken, use the Shopify Add to Cart repair guide. If a promotion changes the outcome, compare the Shopify discount diagnosis. […]