
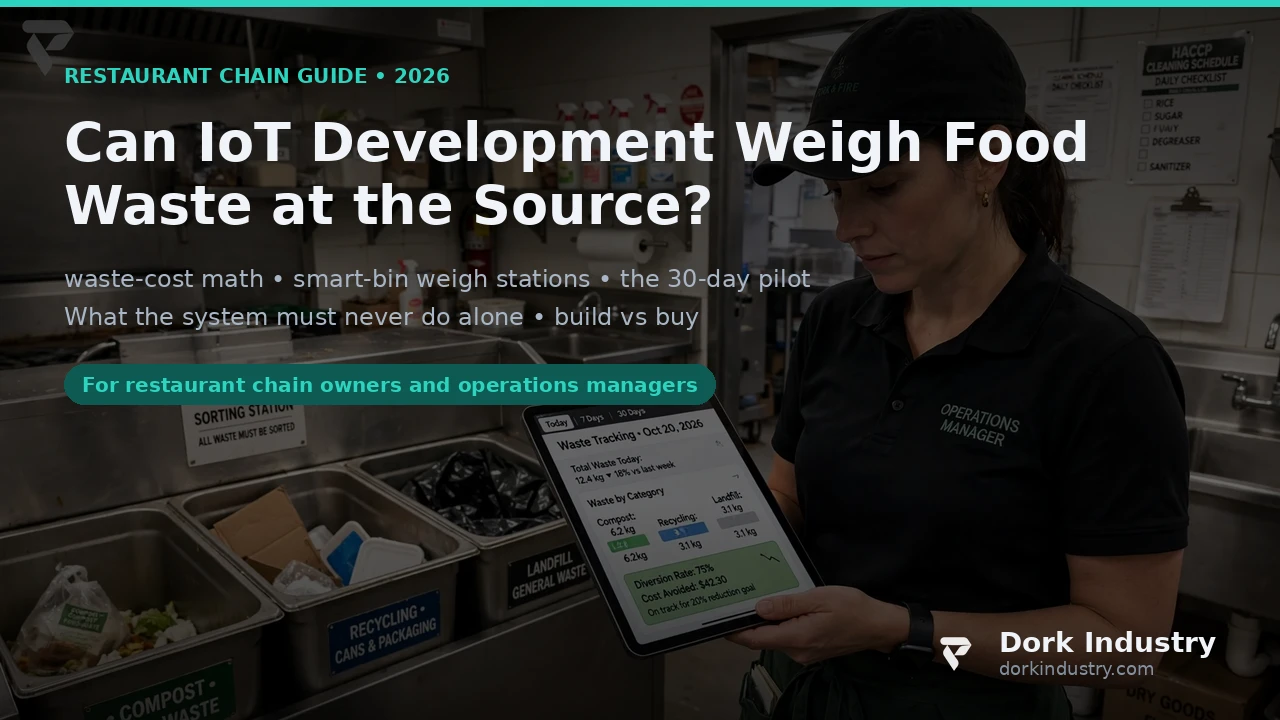
IoT development can weigh restaurant food waste at the source — not by asking your staff to guess better, but by putting load cells under the bins and weigh stations your outlets already use, and sorting every kilogram into prep waste, plate waste and spoilage automatically. That is the direct answer: yes, a multi-outlet chain can finally know which outlet wastes the most, of what, and when — down to the shift. The missing piece is not the sensor; it is a system that turns raw weights into one daily exception list your area manager actually reads.
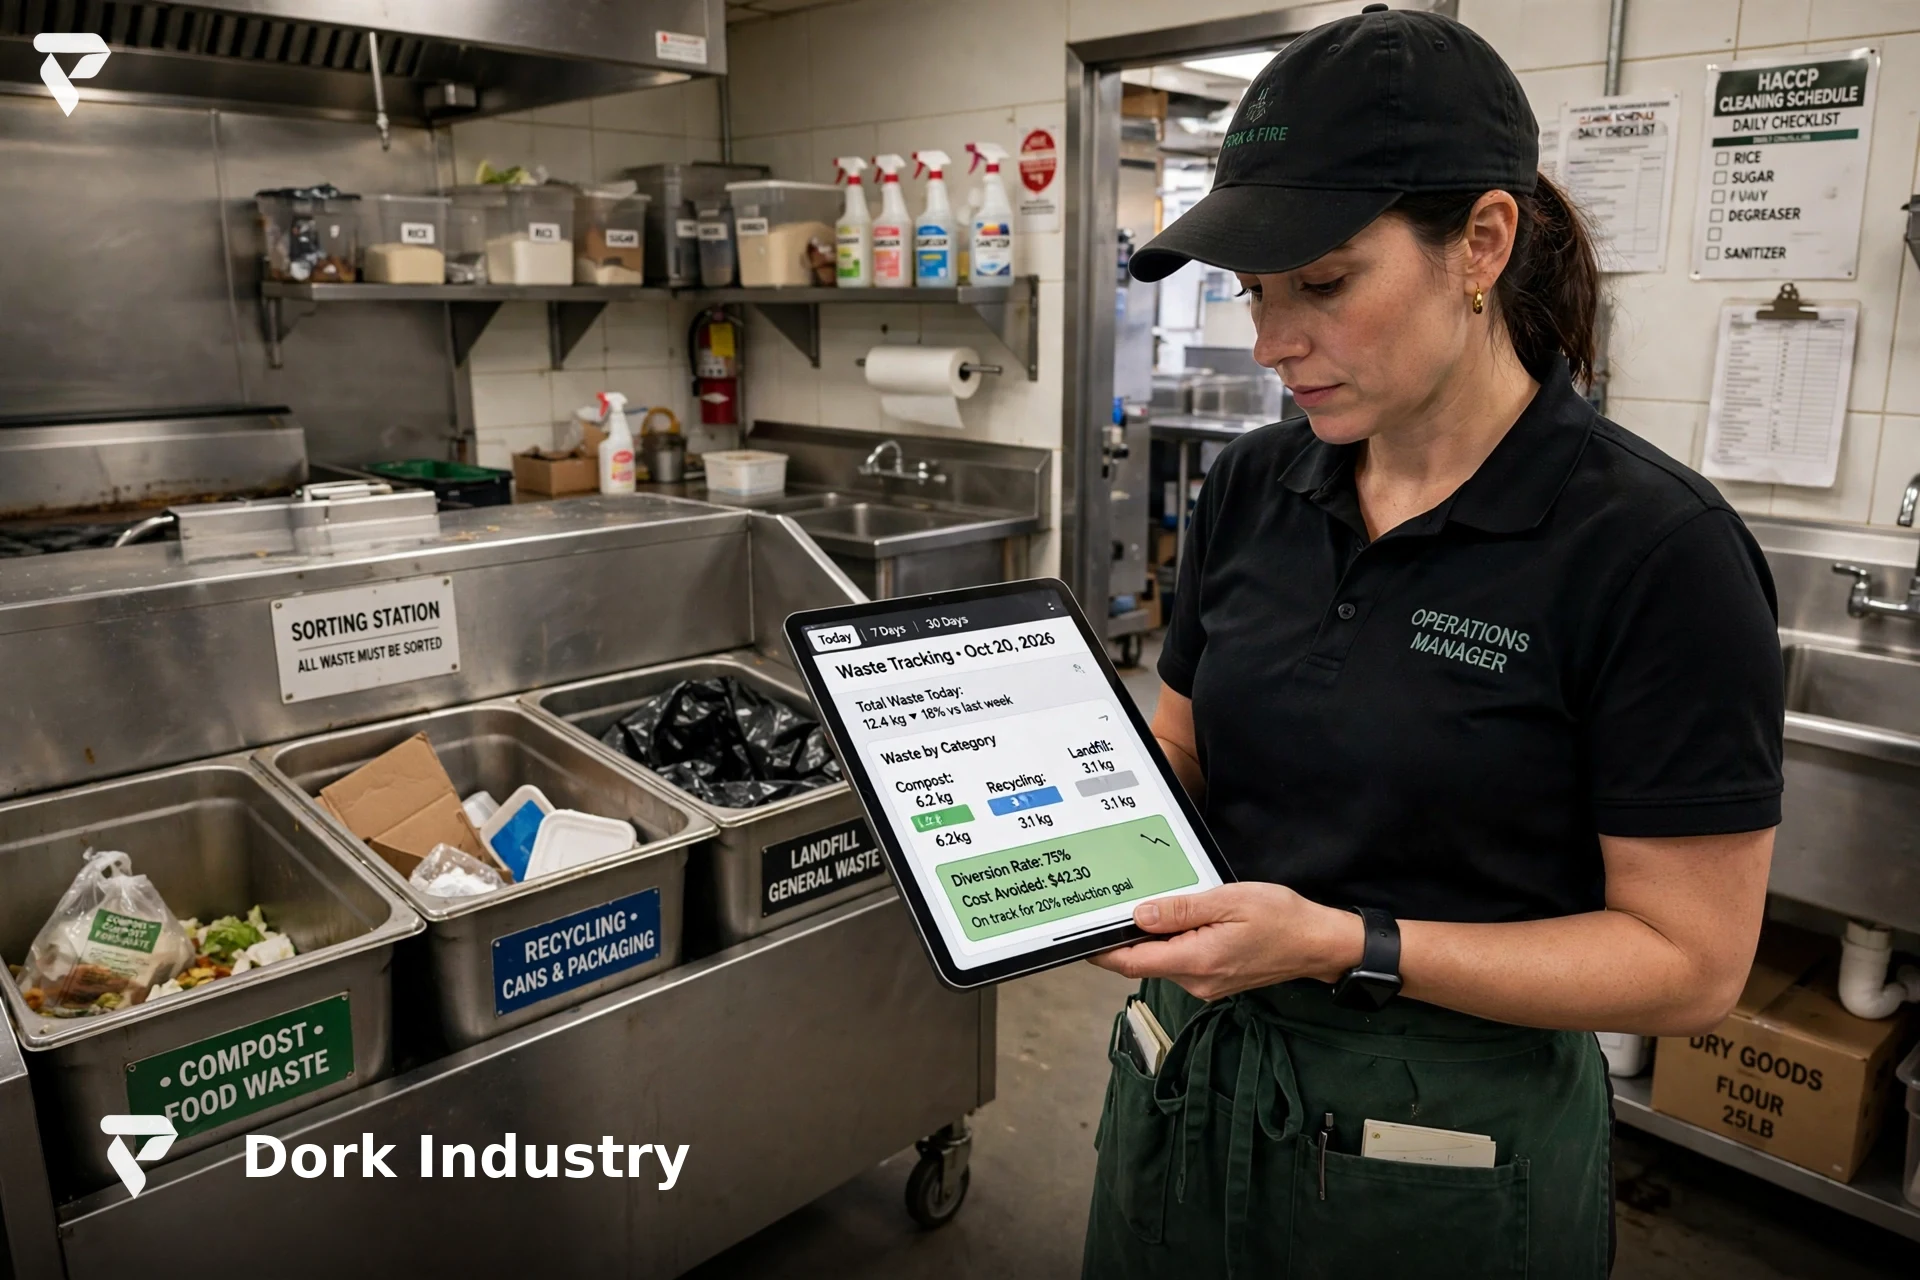
What does untracked food waste actually cost a multi-outlet chain?
The failure is not one dramatic event. It is dozens of small, invisible leaks at every outlet, every day — a tray of biryani nobody ordered, trimmings bagged without a second thought. Each bin looks trivial. Across ten outlets and 365 days, it is one of the largest controllable costs in the business — and it is almost entirely unmeasured.
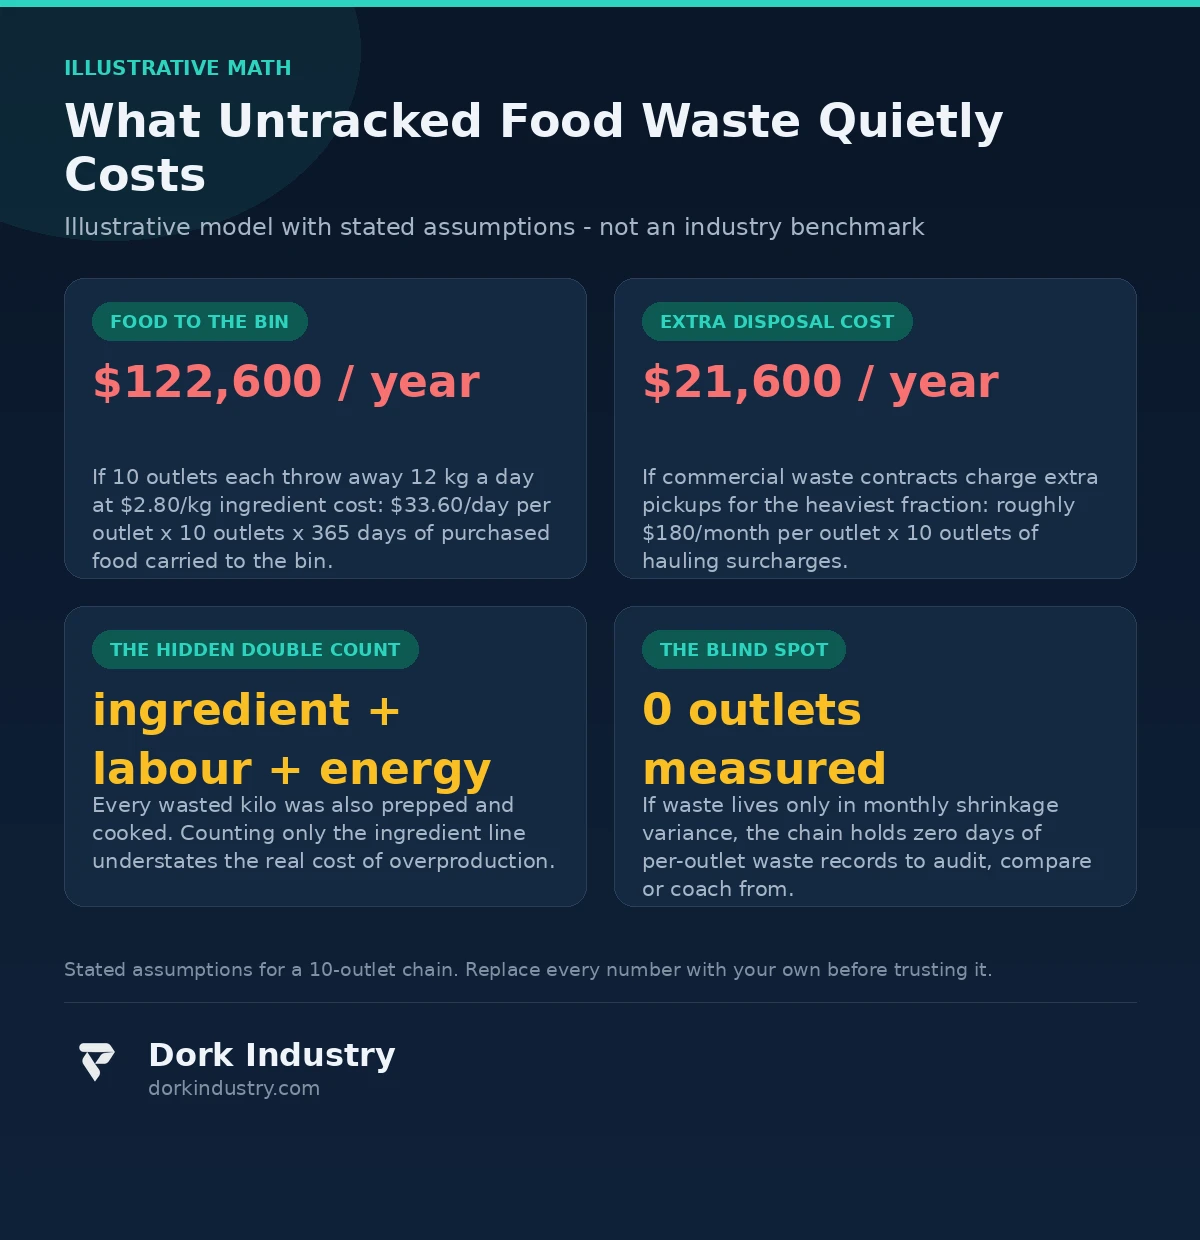
Consider the illustrative model below — stated assumptions, not industry statistics. Ten outlets, each throwing away 12 kg of food a day (prep trim, spoilage and plate returns combined). At an average ingredient cost of $2.80 per kg, that is $33.60 per outlet per day — $336 a day for the chain, or roughly $122,600 a year of purchased food carried to the bin. Now add disposal: most commercial waste contracts charge per pickup, and food waste is the heaviest fraction, so add roughly $180 a month per outlet in extra pickups and surcharges — another $21,600 a year. Then the hidden twin: overproduction is bought, prepped and cooked, so the true cost is ingredient plus labour plus energy; even counting only the ingredient line, one unmeasured chain leaks close to $144,000 a year. The worst part is not the number. It is that nobody in the chain can tell you which outlet leaked the most this week.
Where does the waste quietly go?
Three streams, and they behave differently. Prep waste — trimmings, over-portioned mise en place, batch cookery gone wrong — is the largest stream by weight in most kitchens, and it is where a broken SOP shows up first. Spoilage — expired stock, poor FIFO discipline, cold-room failures nobody logged — is the stream that repeats at the same outlets until someone measures it. Plate waste — food that leaves the kitchen correctly and comes back half-eaten — is a menu and portion-size signal, not a kitchen discipline problem. According to the UN Food and Agriculture Organization, approximately one-third of all food produced for human consumption is lost or wasted, costing roughly USD 1 trillion each year — and US EPA research identifies landfilled food waste as a major driver of landfill methane emissions, with prevention ranked as the most preferred action. Your chain’s bins are a small, expensive corner of that figure — and the only corner you can actually control with a scale.
Why don’t stocktakes and kitchen walk-throughs catch it?
Because they measure the wrong thing. A monthly stocktake reconciles what was bought against what was sold — the variance between them is labelled “shrinkage” and filed away, with no split between theft, spoilage and waste. A manager’s walk-through catches the overflowing bin, not the outlet that quietly wastes 40% more than the one across town. The system was built to count inventory, not to understand loss.
And it is the data that is the problem, not the kitchen staff: most prep waste is habit, training and inconsistent portioning guides — not carelessness; spoilage is usually a cold-chain or ordering discipline problem, not a person problem. When you finally weigh waste per outlet per shift, the honest chain owners discover the worst outlet has the newest, least-trained crew, or the fridge that never quite seals. Data does not just catch waste — it explains it, and the explanation usually changes who you blame.
What data do you already have?
You are sitting on three data sources that make waste weights meaningful — you just have not connected them.
POS sales by item and hour. Every bill tells you what sold and when. Matched against waste weights, it becomes “we sold 40 thalis and wasted 9 kg of rice” instead of a vague “too much waste today.”
Purchase and GRN records. What arrived, at what weight, at what price. The GRN is the ground truth that catches everything else’s lies — a 50-kg vegetable order with 12 kg of daily waste tells its own story.
Portion specs and recipes. The standard cost card per dish. Waste measured against the spec is the only version that counts — “14 kg of prep waste” means nothing until you know the spec says it should be 9.
CCTV and shift rosters for context. A spoilage spike means something different on a night when the freezer alarm tripped than on a night it did not. Waste data without shift context is noise — matched to rosters and cold-room logs, it is an answer.
What does IoT waste-weighing look like in practice?
Concretely, in six stages. Every stage turns a bin into a decision someone can act on.
Stage 1 — Weigh. Load cells under the three sorting stations at each outlet: prep, plate, spoilage. Every weigh event records station, outlet, timestamp and net weight. No new workflow for staff — they already sort waste; now the bin weighs it, using the same sensor-layer pattern we apply across our IoT automation deployments.
Stage 2 — Tag. A simple touchscreen or barcode tap assigns a waste category: trimmings, expired stock, overcooked batch, customer plate returns. According to the US Environmental Protection Agency, food waste at the food-service level covers exactly these streams — plate waste, uneaten prepared food and kitchen trimmings — and its Wasted Food Scale ranks preventing waste ahead of every management pathway, which is why measuring category by category is the first step.
Stage 3 — Match. Weights are matched against the POS: what sold during that shift, what was prepped, what the spec allows. A 6-kg prep-waste spike on a 200-cover lunch is a batch-cookery error. The same spike on a 40-cover weekday is a crew training gap. Without matching, you have alerts. With it, you have answers.
Stage 4 — Rank. The area manager sees one daily list: outlets ranked by waste per cover, with the worst category flagged. Not a dashboard of charts — a short list of kitchens worth a conversation. The ranking is the product; everything else is plumbing.
Stage 5 — Fix. Weekly waste-per-cover rankings go to outlet chefs as numbers, not accusations: “your prep waste per cover is 2.3x the chain average — show me your portioning guide.” Most waste dies in this conversation, because most of it was habits nobody had ever measured.
Stage 6 — Verify. Food cost percentage per outlet, per week — the one number that tells you whether the system works. Watch it weekly, judge it monthly.
What must the system never do alone?
This is the boundary section, and for a kitchen it matters more than the technology. A system that watches bins can do real harm if nobody draws lines around it.
Never penalize kitchen staff automatically. The scale flags weights; humans decide what they mean. A spoilage spike could be a power cut, a supplier’s short-dated stock, or a festival week nobody forecast. Auto-generated penalties based on raw weights are how chains lose their best chefs to their worst algorithms. Every flag is a conversation starter, never a verdict.
Never let waste data follow individual staff. Aggregate to the outlet and the shift, not the person. The minute staff believe the bin is watching them personally, they start hiding waste — and a system nobody trusts produces fiction instead of numbers. Outlet-level and shift-level aggregates preserve the coaching signal without turning the kitchen into a surveillance floor.
Never override the chef’s judgment on quality. The system can note that prep waste tripled on a shift; it cannot know the fish delivery arrived borderline and the chef refused it correctly. Quality decisions outrank waste targets, always — the system learns from the deviation, it does not grade it.
Never publish outlet rankings publicly. Rankings go to the area manager and the outlet chef. A public leaderboard breeds resentment and gaming; a private ranking breeds coaching. The same numbers have opposite effects depending on who sees them.
Never trust a bin you do not calibrate. Load cells drift. A monthly calibration check with a known test weight is part of the product, not an afterthought.
When should you NOT build waste-weighing?
Honest answer: not every restaurant should. A single outlet where the owner is in the kitchen daily? You already see the bins — a conversation is cheaper than any system. Kitchens with no portion specs on paper will generate “waste” numbers with nothing to compare them to — write the specs first, weigh second. And if nobody will own the weekly review with outlet chefs, you simply replace an ignored food-cost report with an ignored waste dashboard. We say this to prospects plainly; the same honest lens applies to our custom software development work — weighing is only worth building when a manager will act on what it finds.
What does a 30-day pilot look like?
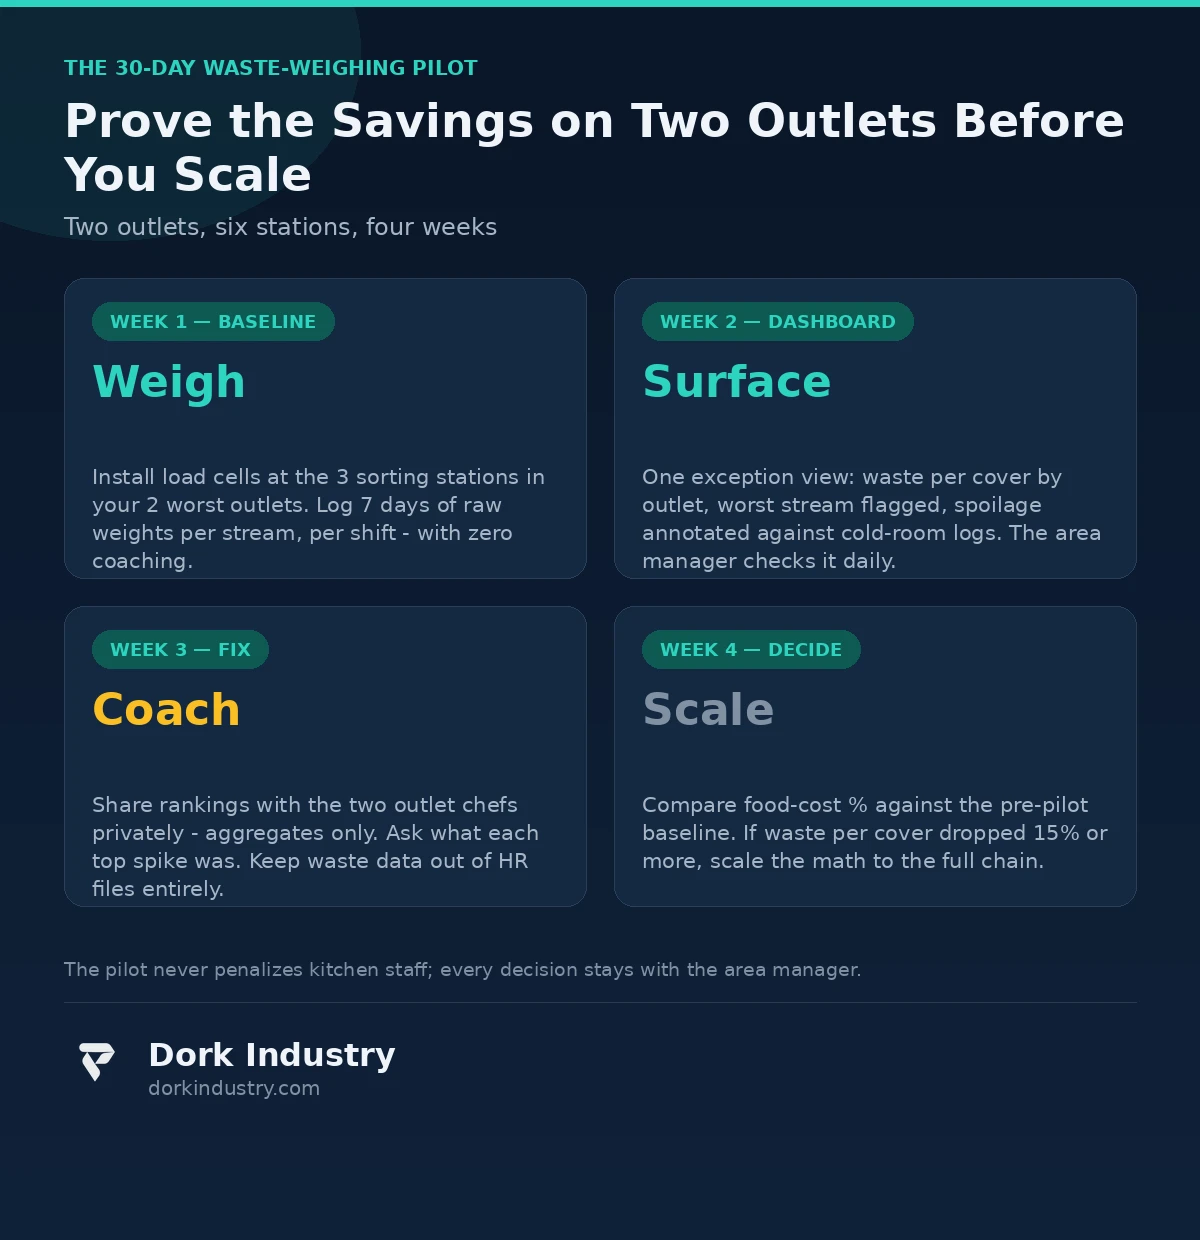
Week 1 — Baseline. Install load cells at the three stations in your two worst-performing outlets. Log one full week of raw weights with zero coaching and zero menu changes. Measure the real numbers: kg per cover by stream, by shift. Do not tell the kitchens what you expect — you want the truth, not the performance.
Week 2 — Surface. Build the single exception view: waste per cover per outlet, worst category flagged, spoilage spikes annotated against cold-room logs. The area manager checks it each morning. Every spike gets classified: batch error, ordering, spoilage, plate returns — and “unknown” is the interesting column.
Week 3 — Fix. Share the numbers with the two outlet chefs privately — aggregates only, no penalties. Ask what each top spike was — a spec problem or a procurement problem. Keep waste data out of HR files entirely.
Week 4 — Decision. Compare food-cost percentage against the pre-pilot baseline. If waste per cover dropped 15% or more, scale the illustrative math to the full chain and you have the business case. If nothing moved, you learned it without wiring ten outlets. The same discipline of small measurable bets runs through our web development engagements.
What drives the cost of a waste-weighing build?
Four cost drivers, in order of impact. Station heterogeneity: three identical sorting stations across outlets is a weekend; mixed layouts mean per-outlet load-cell mounting and calibration. Hardware ruggedness: consumer scales cost little but die in a commercial kitchen; IP-rated load cells with wipe-down enclosures cost far more but survive heat, steam and daily washing. POS and inventory integration: matching waste against sales requires reading your POS and GRN data; if both export cleanly, integration is days — if the GRN lives in a register book, the plumbing comes first. Exception and privacy design: a ranked list for the area manager is simple; outlet-only views, shift aggregates and calibration routines are a product in themselves.
How do manual audits, spreadsheets and IoT weighing compare?
| Dimension | Manual waste audits | Spreadsheet food-cost reports | IoT waste-weighing |
|---|---|---|---|
| Measurement | Sampled — one week per quarter, then forgotten | None — waste is buried inside shrinkage | Continuous: every weigh event, every shift, every outlet |
| Outlet comparison | Impossible — different auditors, different weeks | Only at food-cost %, no cause | Ranked by waste per cover with category split |
| Root cause | Anecdotes from the audit week | Month-end variance, already stale | Stream × shift × menu item, matched to POS |
| Staff trust | High friction — an audit feels like inspection | No friction, no insight | Works if aggregated and never used to penalize individuals |
| Decision speed | Quarterly at best | 30 days after the waste happened | Daily exception list the area manager reads |
The bottom line
IoT development does not make your kitchens disciplined — most of them already are. What it does is replace the argument about which outlet wastes the most with a record: kilograms per cover, by stream, by shift, matched against what sold. If your chain loses food it cannot account for, the question is not whether the bins can report it — they can, the moment you put a scale under them.
Wasting food at every outlet but can’t prove where?
Send Dork Industry one week of your GRN and POS data from two outlets. We will estimate your real waste cost per cover, show you what a load-cell weigh station records on day one, and design the two-outlet, 30-day pilot for your chain.
Request a free food-waste monitoring assessment WhatsApp +91 8210792477
About Dork Industry
Dork Industry (dorkindustry.com) is a custom software development company building mobile apps, AI automation, and IoT systems for businesses across India. Our team designs sensor-to-dashboard waste pipelines, per-outlet exception rankings and chef-coaching workflows — from 30-day two-outlet pilots to full chain rollouts, with the same rigor we apply to AI automation for business processes.
Frequently asked questions
Can IoT development really weigh restaurant food waste automatically?
Yes. IP-rated load cells under the prep, plate and spoilage stations record net weight per event with a timestamp — no manual weighing, no clipboards. The weighing still needs your waste categories and portion specs, or you get numbers with no story.
Will kitchen staff tamper with the bins?
They sabotage surveillance; they tolerate measurement. Pilots that work aggregate data to the outlet and shift, never follow individuals, and lead with coaching instead of penalties. The boundaries in this article — private rankings, no auto-penalties — are what makes adoption possible.
Do I need new sensors at every outlet for a pilot?
No. Start with two outlets and the three sorting stations each — six load-cell stations total. If the pilot shows waste per cover dropping, the chain-wide math sells the rollout. If it shows nothing, you learned it cheaply.
How is this different from a monthly food-cost report?
A food-cost report tells you the money is gone, 30 days late, with no cause. Waste-weighing tells you which stream, which shift and which outlet — daily — so the area manager can fix the cause while the week is still in play.
What does a food-waste pilot need from my team?
Three things: one day of station-installation access at two outlets, one week of GRN and POS exports, and one area manager willing to check the daily ranking. With those, the pilot hands you the business case for the full chain in four weeks.

[…] Theme code rarely controls the core hosted payment-method list, but custom carts, checkout extensions, payment customizations and apps can influence the journey or eligibility. If the cart itself is broken, use the Shopify Add to Cart repair guide. If a promotion changes the outcome, compare the Shopify discount diagnosis. […]