AI automation can stop food-cost leakage from untracked waste in multi-outlet restaurants — yes, measurably — but only as a measurement and early-warning system, never as an autonomous controller. The short answer: an AI automation layer that reconciles what your kitchens should have used (from POS sales and recipe bills of materials) against what they actually used (from supplier invoices and inventory depletion) can surface the waste, over-portioning and spoilage that monthly spreadsheets hide — outlet by outlet, ingredient by ingredient. It cannot taste food, override a chef’s judgment on the pass, or accuse anyone of theft. If your group has ever watched food cost creep two points while every outlet insists its numbers are fine, the fix is daily theoretical-vs-actual reconciliation, piloted on one outlet for 30 days.
This article walks through why food cost leaks silently in multi-outlet groups, what the leakage actually costs, what data your restaurants already generate, what AI automation concretely builds, what the system must never do alone, and how to test the idea in a 30-day pilot before committing to a build.
Key takeaways:
- AI automation can cut food-cost leakage from untracked waste, over-portioning and spoilage — as a measurement and alert system, never an autonomous controller.
- Illustrative: a 5-outlet group leaking 4% of food cost loses roughly ₹8.6 lakh a year (illustrative figures with stated assumptions, not benchmarks).
- The signals already exist — POS sales, recipe BOMs, supplier invoices, inventory counts — groups just never reconcile them daily.
- The AI must never auto-adjust recipes, accuse staff of theft, auto-order from suppliers, or override a chef’s quality calls.
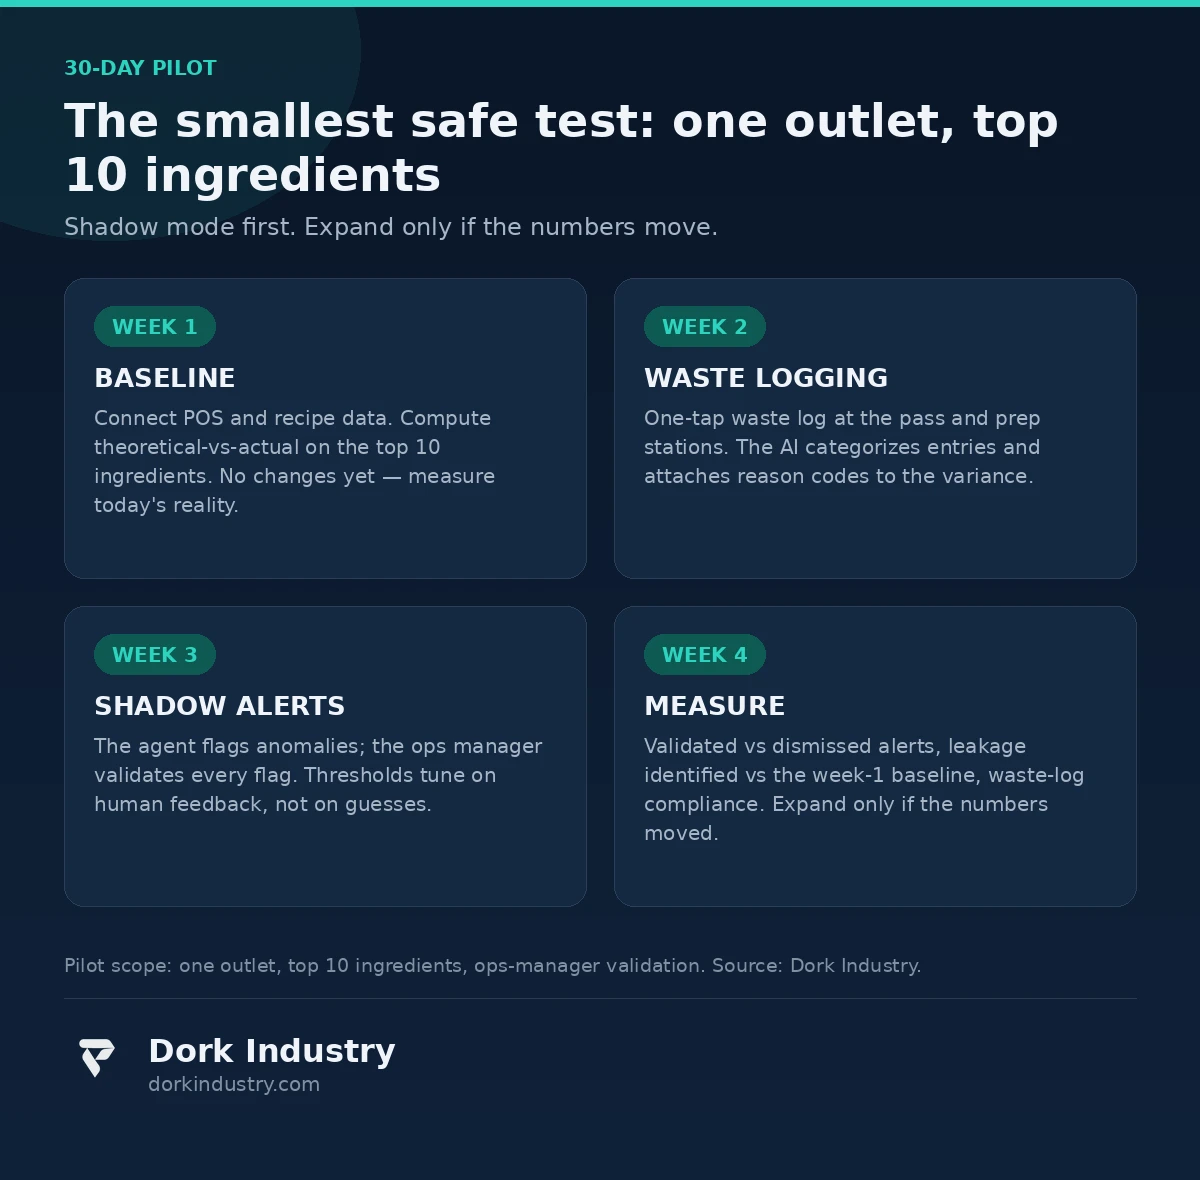
- A 30-day, single-outlet pilot in shadow mode — baseline variance, waste logging, validated alerts — is the smallest safe test.
Why does food cost leak silently in multi-outlet groups?
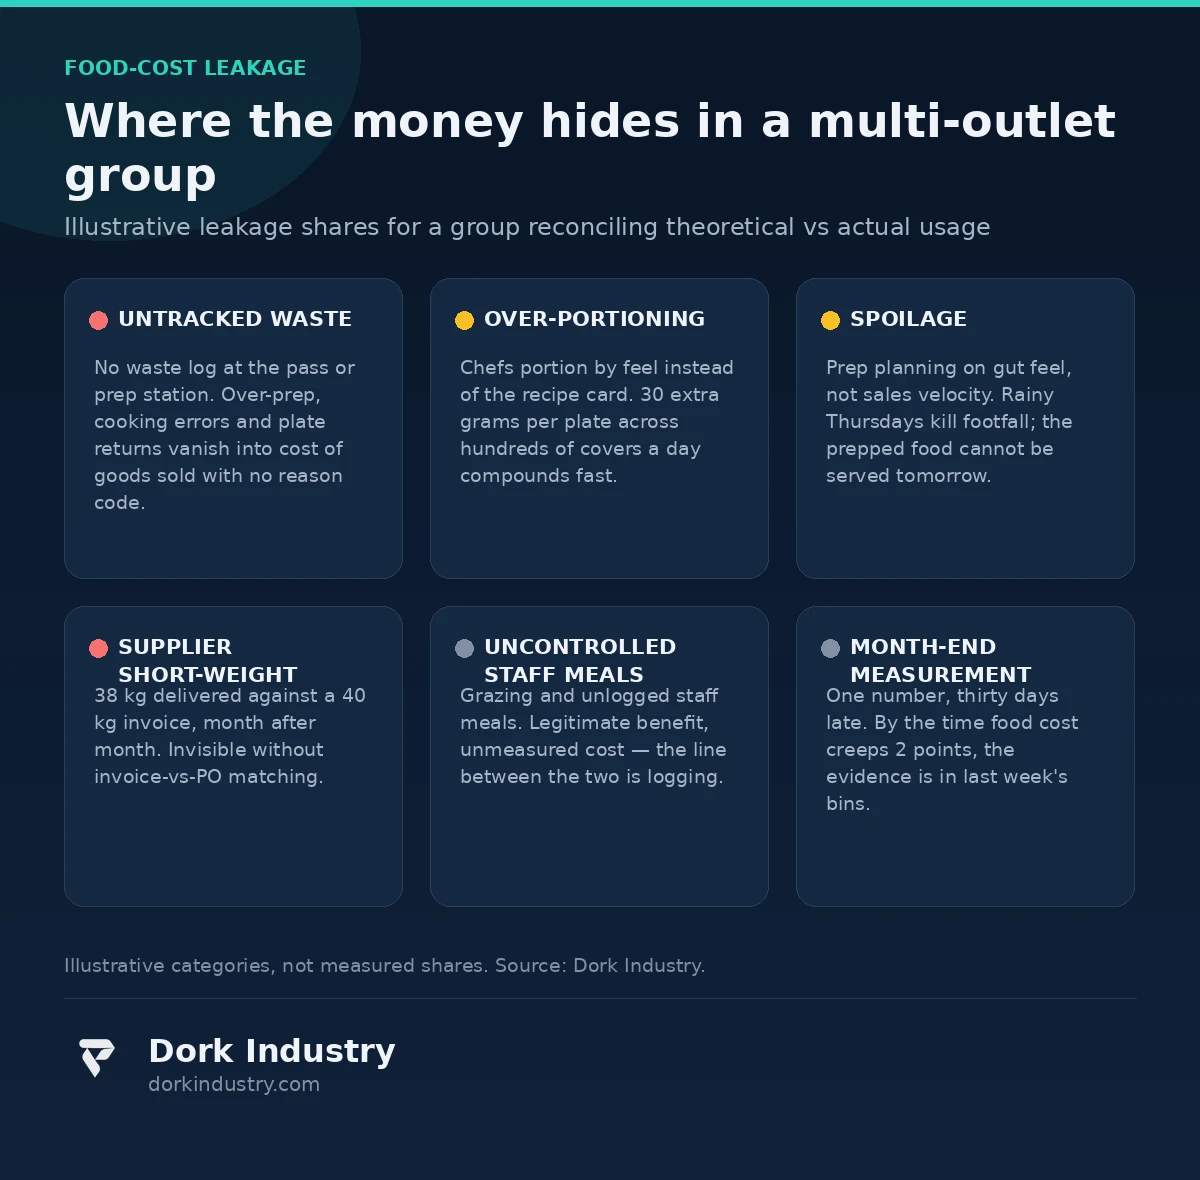
It is not one big theft. It is a hundred small leaks nobody adds up: a chef at outlet three portions 20 grams more paneer per tikka than the recipe card says; outlet five preps for a weekend rush that never arrives and dumps two trays of marinated chicken; a supplier quietly delivers 38 kg against a 40 kg invoice for three months. Each outlet feels normal. The group P&L feels wrong. Three patterns repeat across every multi-outlet group we have seen.
Why does nobody notice a 2% creep?
Because the measurement cadence is monthly and the leakage is daily. A monthly food-cost report aggregates thirty days of drift into one number — 31.8% this month versus 29.6% last month — with no trail back to which ingredient, which outlet, or which week caused it. By the time the number lands on the owner’s desk, the evidence (yesterday’s waste bin, last week’s spoiled dairy) is gone. Daily reconciliation exists in theory; in practice it dies because it means someone opening three spreadsheets every night.
Why do identical outlets have different food costs?
Menus match, recipes match, suppliers match — but humans differ. One head chef follows the 180-gram portion card religiously; another “cooks by feel” and portions 210. One outlet’s receiving clerk weighs every delivery; another signs and stacks. The variance between your best and worst outlet is your leakage map, but most groups never rank outlets on ingredient variance because the data to do it lives in four disconnected systems.
Why is spoilage invisible until month-end?
Prep planning is done on gut feel and last week’s sales memory. A rainy Thursday kills footfall, the prepped biryani rice and kebabs sit, and the loss is buried inside “cost of goods sold” with no reason code attached. According to ReFED, restaurants and foodservice operations generated about 13 million tons of surplus food in 2023, with nearly 80% going to landfill — and overproduction is the leading back-of-house cause. Your group is a small slice of that number, but the mechanism is identical.
What does food-cost leakage actually cost?
Consider an illustrative five-outlet group. These are illustrative figures with stated assumptions, not industry benchmarks: assume each outlet does ₹12 lakh in monthly revenue, a 30% food cost, and a 4% unaccounted leakage rate — the gap between what the recipes say the food should cost and what it actually costs, after counting everything you can explain.
Group revenue: 5 × ₹12,00,000 = ₹60,00,000 per month. Food cost at 30% = ₹18,00,000 per month. A 4% leakage on that = ₹72,000 per month, or roughly ₹8.64 lakh per year — money spent on food that never became a served dish. To put that in context, according to the National Restaurant Association, food and labor each accounted for approximately 33 cents of every dollar in restaurant sales before the pandemic, leaving a pre-tax profit margin of roughly 5%. On 5% margins, a 1.2-point food-cost creep (4% of a 30% food cost) can erase a quarter of your profit — before a single customer complains.
The illustrative scenario also assumes the leakage is fixable: it is the untracked, unmeasured kind — waste nobody logs, portions nobody weighs, spoilage nobody codes. A daily reconciliation alert arriving the same week converts a year-end mystery into a Tuesday correction.
What data do your restaurants already generate?
Most groups already hold the raw material; it is just never assembled. Your POS records every item sold, by outlet, by hour. Your recipe cards (or the head chef’s head) hold the bill of materials: 180 grams of paneer, 40 grams of butter, one naan per tikka plate. Your supplier invoices show what arrived and what it cost. Your weekly or monthly stock counts show what is left. What is missing is the daily multiplication of the first two and the comparison against the last two — the theoretical-vs-actual reconciliation that turns four disconnected records into one leakage number. An AI automation workflow does exactly that arithmetic every night, in a form your ops manager can act on, without creating new data-entry work for kitchen staff.
What does AI automation actually build in a multi-outlet group?
Strip away the buzzwords and the system is six concrete components, each with a human checkpoint:
- Daily theoretical-vs-actual engine: every night, the system multiplies each outlet’s POS sales by its recipe BOMs to compute what should have been consumed, then compares it against actual depletion from invoices and inventory. The output is a variance number per ingredient per outlet — paneer +6.2% at outlet three, dairy +9.1% at outlet five.
- Waste logging workflow: a one-tap log at the pass or prep station — photo plus reason code (over-prep, spoilage, cooking error, customer return). The AI categorizes and totals it; the kitchen spends seconds, not minutes.
- Spoilage prediction from sales velocity: the agent watches each outlet’s sales pace against ingredient shelf life and flags over-prep risk before the prep happens — “Thursday’s chicken prep should be 60% of normal; footfall is trending 30% down this week.”
- Supplier invoice vs receiving checks: delivered weights and prices are matched against purchase orders and invoice lines automatically. The 38-kg-against-40-kg pattern surfaces as a supplier variance report, not a hunch.
- Outlet benchmarking dashboard: every outlet ranked on the same variance metrics, so the ops manager sees which outlet leaks and on which ingredient. This is the same reconciliation discipline we described for ending warehouse-vs-ERP inventory mismatches — the industry differs, the discipline of reconciling two truths daily is identical.
- Alert routing with evidence: each alert arrives with the numbers attached — “Outlet 3, paneer variance +6.2% this week, driven by waste-log entries on Friday and Saturday” — routed to the ops manager, not blasted at chefs.
Note what is deliberately absent from this list: automatic recipe changes, automatic supplier orders, and anything that touches the food itself. The system measures the money around the food.
How does the AI turn POS data into a waste signal?
| Signal the AI watches | What it usually means | Typical finding |
|---|---|---|
| Theoretical vs actual per ingredient | Over-portioning, unlogged waste, or pilferage | One or two hero ingredients carry most of the variance |
| Waste-log reason codes by outlet | Over-prep culture or weak forecasting | Over-prep dominates at outlets with the weakest prep sheets |
| Sales velocity vs shelf life | Spoilage risk before it happens | Weekend prep volumes ignore weekday footfall patterns |
| Invoice vs purchase-order matching | Supplier short-weight or price drift | Small, persistent shortfalls on high-value proteins |
| Outlet-to-outlet variance ranking | Process discipline differences | Best and worst outlets differ by 3–5 points on identical menus |
Findings vary by group — the point is that the variance concentrates in a few ingredients and a few outlets, and that concentration is what a daily signal reveals.
What must the AI never do alone?
Boundaries matter in a kitchen, because a bad automated action can destroy trust faster than leakage destroys margin.
- Never auto-adjust recipes or portions. Portion discipline is a management decision, enforced by humans. An algorithm silently shrinking portions would change the product customers pay for.
- Never accuse staff. A variance pattern goes to the ops manager as “investigate,” never to the floor as an accusation. Theft suspicions need human evidence and human process — the system flags numbers, not people.
- Never auto-order from suppliers. A flagged anomaly goes to the purchasing manager, who confirms before money moves. Automated ordering on unvalidated signals burns cash and relationships.
- Never override chef quality calls. If a chef rejects a batch of produce as substandard and it goes to waste, the system logs the reason — it does not second-guess the call or penalize the outlet.
- Never shame outlets publicly. Rankings are an ops-management tool. Broadcasting “worst outlet of the month” to every kitchen breeds resentment and gaming, not discipline.
Should you build custom, buy a package, or do nothing?
Not every restaurant group needs custom AI automation. The honest options, in order of investment:
| Approach | Best for | Relative investment | Where it breaks |
|---|---|---|---|
| Packaged restaurant inventory software | 1–3 outlets, standard menus | Low subscription | Generic variance reports; no learning your group’s patterns |
| POS-native reporting + discipline | Groups with a strong ops manager | Minimal | Dies the week the ops manager gets busy |
| Custom AI automation | 5+ outlets, divergent variance, central commissary or franchisees | Highest | Overkill for a single outlet with tight existing controls |
| Do nothing (monthly reviews) | Groups where food cost is already stable | Zero | Leakage compounds silently; you find out at year-end |