
AI automation can take your weekly marketing report from a two-day manual assembly job to a draft that builds itself overnight. Yes: by pulling GA4, ad-platform and CRM data through their official APIs on schedule, reconciling the numbers, flagging conflicts for a human, and drafting the narrative with charts, a pipeline can put a review-ready draft in your inbox before your team logs in — as long as a named person still approves anything that reaches a client or moves budget. The expensive part of reporting was never the writing; it was the exporting, pasting and re-checking that happened before anyone wrote a word.
This article examines where manual marketing reporting actually loses money, why a dashboard never replaced it, what data you already own, what an overnight AI automation pipeline looks like in concrete terms, what the system must never do alone, when you should not automate at all, and how to test the idea in a 30-day pilot.

What does “building marketing reports by hand” actually cost?
The cost is not the report. The cost is the senior person spending a working day being a data-entry clerk, and the decisions made on numbers that were stale before the report was sent.
Where do the hours really go?
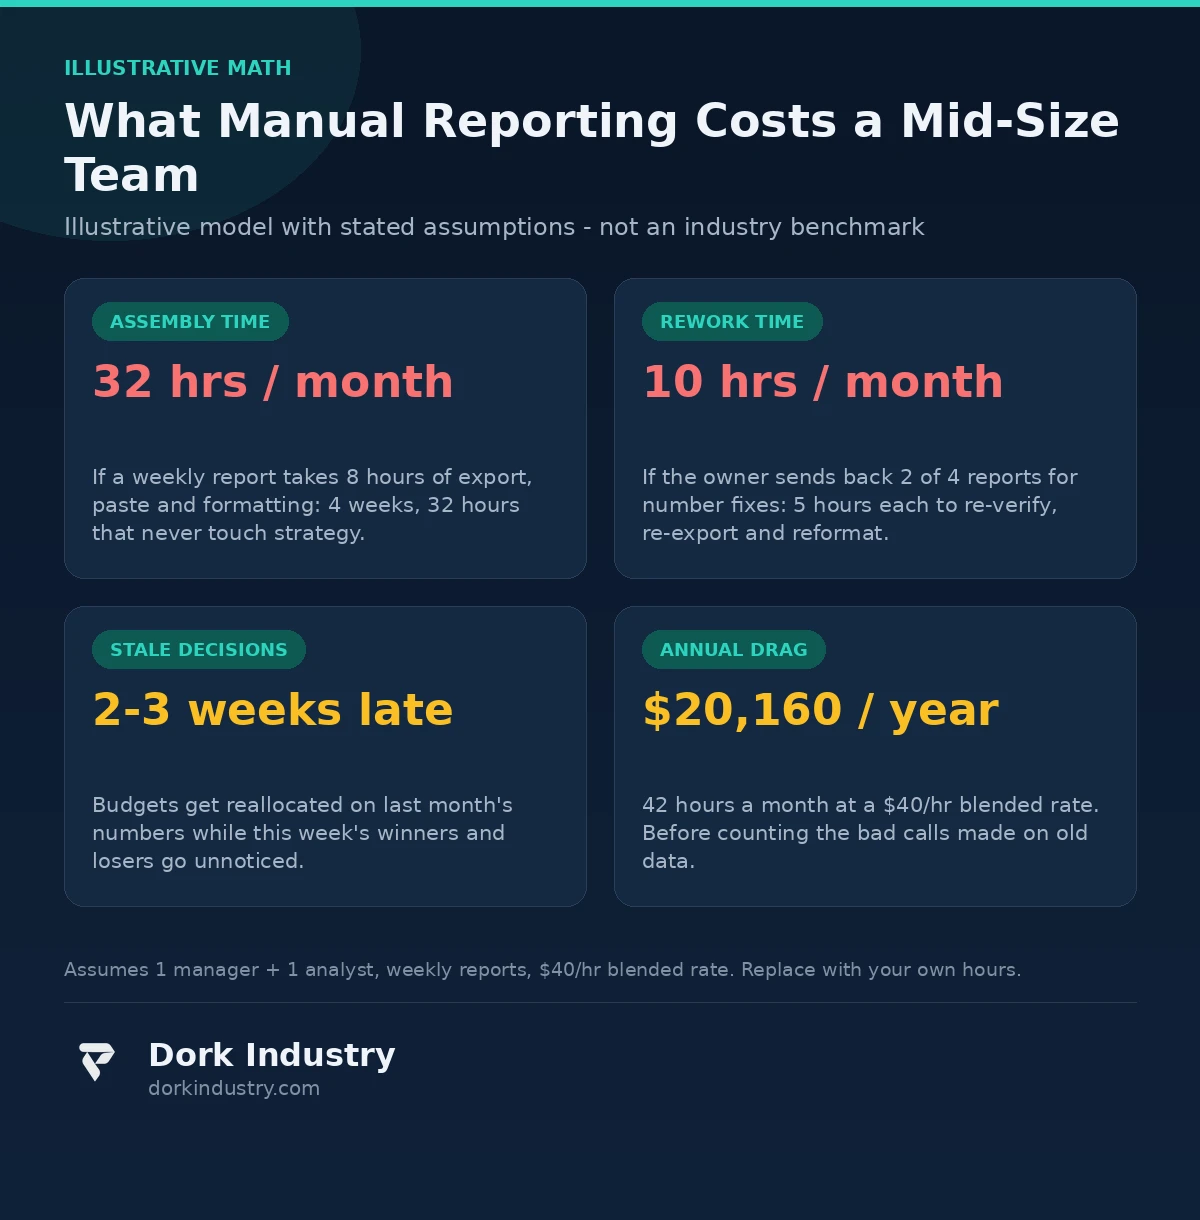
Export the ad-platform CSVs. Export the same date range from GA4. Download the CRM lead list. Paste everything into a spreadsheet template that broke the last time someone renamed a campaign. Fix the formulas, rebuild the charts, write the summary. That is the honest anatomy of a weekly report: eight or more hours of export, paste, reconcile and format, plus a corrections round when the owner spots a number that does not match the ad account. Two of four reports a month typically go back for rework at roughly half a working day each. Then consider the illustrative model below — stated assumptions, not a benchmark: 32 hours of assembly plus 10 hours of rework a month, 42 hours at a $40-per-hour blended rate, which is $1,680 a month or $20,160 a year. Before counting a single bad decision made on old numbers.
How do stale numbers change the decisions you make?
A report that takes ten days to produce is a report about a month that is already over. Budgets get reallocated on last month’s winners while this month’s campaign quietly burns spend. A landing page with broken conversion tracking goes unnoticed for two reporting cycles because nobody looks at raw data between reports. The stale-report tax is invisible because it shows up as “the campaign underperformed,” not as “we saw it two weeks late.” An overnight pipeline shrinks the gap between what happened and when you knew from weeks to hours.
Why hasn’t a dashboard already solved this?
Most companies that still build reports by hand already own a dashboard. The dashboard was supposed to end the weekly spreadsheet. It did not, and the reason is structural.
What is the difference between a dashboard and a report?
A dashboard answers “what is the number right now.” A report answers “what happened, why it matters, and what we should do next.” Dashboards get opened once and abandoned because they never explain themselves: the chart is green, but nobody knows whether green is good or an artifact of a broken tracking pixel. The weekly report exists because someone has to turn numbers into a story a human can act on. Automation moves that job instead of removing it: the pipeline assembles at 4 AM, and the manager spends Monday morning on the only part a human can do — judgment.
What data do you already have to feed an automated report?
You almost certainly own more reporting raw material than you think. The expensive APIs are already paid for; the data is sitting behind logins nobody opens.
Web analytics. Google Analytics 4 holds sessions, conversions, traffic sources and engagement per page. According to Google’s Analytics Data API documentation, GA4 reporting data can be queried programmatically with the same dimensions and metrics as the interface — no reason to export GA4 by hand ever again.
Ad-platform spend and results. Meta’s Marketing API exposes campaign-level delivery data including impressions, spend, clicks and results; according to Meta’s Marketing API insights documentation, these insights can be pulled for any date range and broken down by placement and time. Google Ads offers the same through its reporting surface — according to Google’s Ads API reporting overview, any report visible in the Google Ads UI can be built programmatically. That covers the two places where the money actually goes.
CRM and sales data. Leads, opportunities, closed deals and revenue live in your CRM. This is the data that turns “we spent $12,000 and got 400 leads” into “we spent $12,000 and got 61 qualified opportunities worth $340,000 in pipeline” — the only sentence the owner actually cares about.
The messy rest. Organic rankings, email platform stats, spreadsheets from partners, offline sales. These arrive by export or email, and a good pipeline accepts them as scheduled uploads rather than pretending they will ever get an API.
How does an AI automation reporting pipeline work overnight?
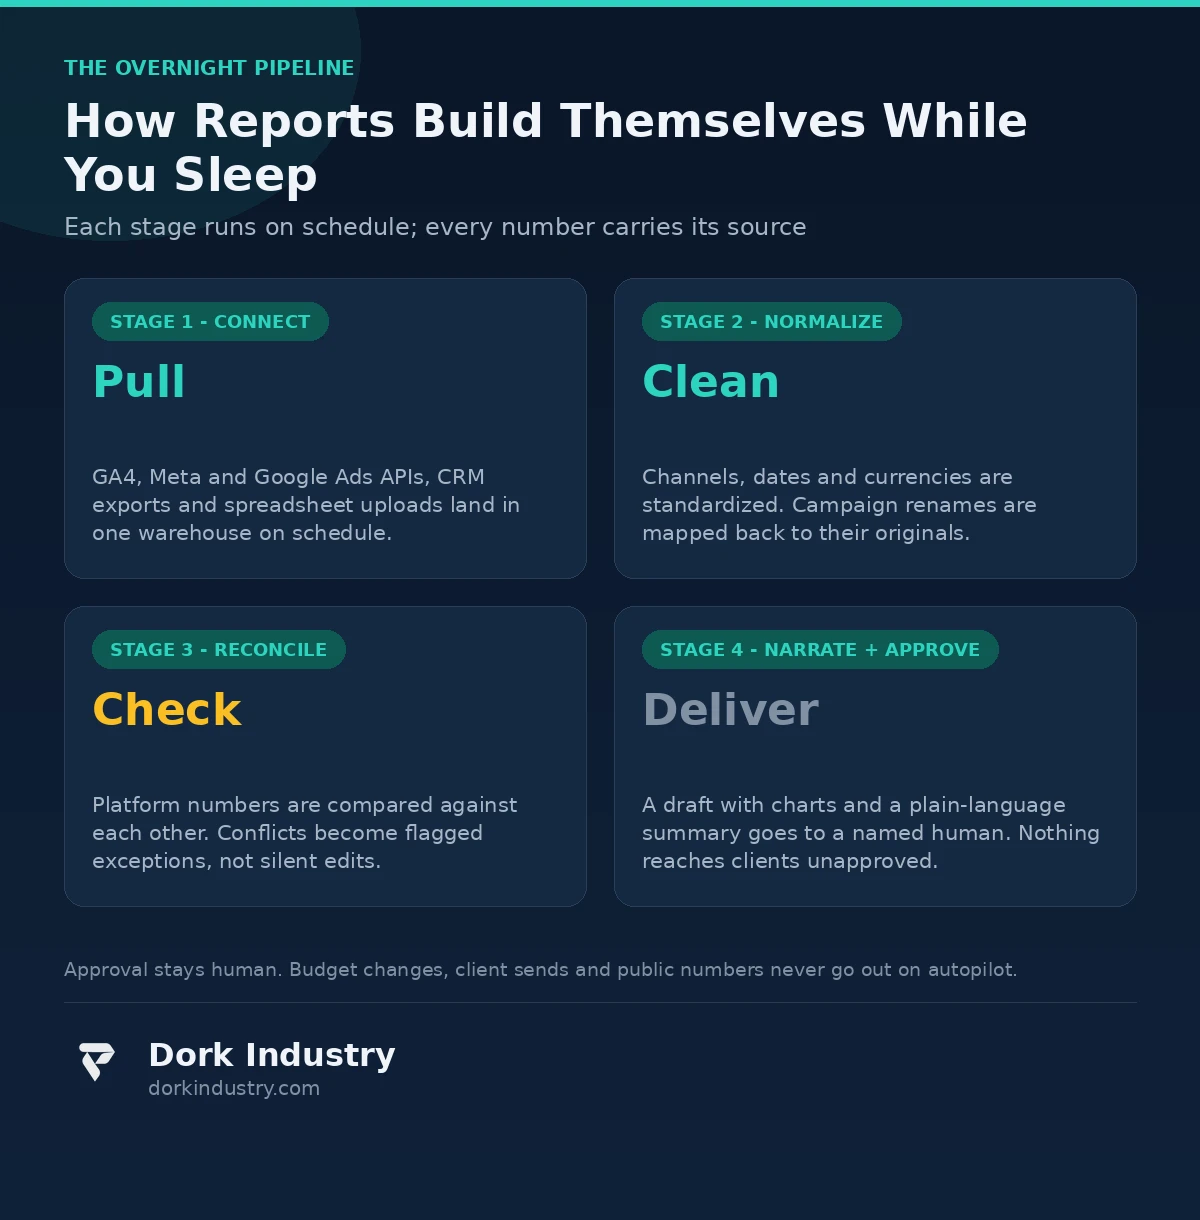
Concretely, in four stages that run on a schedule — typically between 2 AM and 6 AM, so the draft is waiting at 8 AM.
Stage 1 — Connect. Scheduled jobs pull each source through its official API with stored credentials: GA4 through the Data API, Meta and Google Ads through their reporting APIs, CRM through its export or API. Nothing is copy-pasted by a person.
Stage 2 — Normalize. The pipeline standardizes what platforms name differently. A campaign renamed mid-month in Meta Ads gets mapped back to its original. Dates align to one timezone, spend and revenue to one currency. This is where 90% of manual spreadsheet breakage used to happen, and it is pure deterministic code.
Stage 3 — Reconcile. This is where reporting automation earns its keep, and the stage most dashboard connectors skip. The pipeline compares the numbers against each other: does Meta’s conversion count match the CRM’s lead count for the same period? When sources disagree beyond a tolerance — and they will, because every platform attributes differently — the pipeline does not silently pick one. It writes a flagged exception: “Meta reports 214 leads, CRM shows 187 for the same period; difference exceeds 10% tolerance.” That exception list is the most valuable part of the report, because it is exactly what the manual process buried in silence.
Stage 4 — Narrate, approve, distribute. With clean, reconciled numbers, the pipeline generates the charts and drafts a plain-language narrative: what moved, by how much, what changed versus last week, and which exceptions need attention. The draft goes to a named human — the marketing manager or agency account lead — who reviews, edits and approves. Only then does it go to clients or the owner. The pipeline does the assembly; the human does the judgment.
What must the system never do alone?
This is the boundary section, and it matters more than the technology. A reporting pipeline that runs unattended can do real damage if nobody draws lines around it.
Never change budgets or bids on its own. A report that notices ROAS collapsing and quietly pauses the campaign is an agent with a company credit card. The pipeline reports; a human reallocates.
Never send anything to a client unapproved. Drafts are drafts. A wrong number in an internal report is an embarrassment; a wrong number in a client report is a contract problem. Approval stays with a named person, every cycle.
Never invent explanations. The narrative layer must describe what the data shows and flag what it cannot explain. “Conversions dropped 23% week over week; no tracking anomalies detected” is honest. “Conversions dropped because of the holiday” is a guess wearing a chart’s clothing — and it is exactly the kind of confident-sounding fiction that gets trusted because it arrived in a formatted report.
Never silently resolve data conflicts. When Meta says 214 and the CRM says 187, picking one without telling anyone is how reports quietly become fiction. Exceptions stay visible until a human closes them.
Never leak credentials or client data. API tokens live in a secrets store, not in the spreadsheet. Client A’s data never lands in Client B’s warehouse, even in a multi-tenant agency setup. This is plumbing, not philosophy, but it is where most DIY pipelines fail first.
When should you NOT automate your reporting?
Honest answer: not every team should. If you run one channel and a monthly report that takes two hours, automation is a sledgehammer for a nail — keep the spreadsheet. If your data sources change every quarter, you will spend more maintaining the pipeline than it saves. And if nobody reads the current report, automating it just produces unread reports faster. The pipeline is for teams where the report is read, the numbers move decisions, and assembly eats days every month. We have told prospects exactly this, including when it cost us the project; the same honest lens applies to our custom software development work and to the document-heavy automation we build for operations like purchase-order processing.
What does a 30-day pilot look like?
Week 1 — Inventory and connections. List every data source the current report uses. Connect the APIs that exist (GA4, Meta, Google Ads typically take a day each including credential setup). Document the spreadsheet-only sources and set up their upload path.
Week 2 — One report, fewer sources. Automate the single most painful report for the top two or three data sources only. Run it in parallel with the manual process so every number can be compared.
Week 3 — Reconciliation and exceptions. This is where the pilot pays for itself. The parallel run surfaces every place the manual report was quietly wrong: the campaign rename that broke a formula, the attribution mismatch nobody noticed. Tune tolerances with the person who owns the report.
Week 4 — Approval workflow and handover. Wire in the approval step: the draft arrives, the owner reviews, edits and approves. Measure the time: if the manual process took 8 hours and the review takes 45 minutes, the pilot has its number.
What drives the cost of a reporting automation build?
Four cost drivers, in order of impact. Data-source count and messiness: three clean APIs are a week; eight sources with spreadsheet uploads and renames are a month. Reconciliation complexity: comparing platform numbers against the CRM across attribution models is where the engineering goes. Approval and distribution workflows: one approver is trivial; multi-client agency approvals with per-client formats are a product in themselves. Historical backfill: rebuilding two years of history for trend charts multiplies the data work. The 30-day pilot exists so you learn which shape you need before committing.
How do manual, dashboard-only and automated reporting compare?
| Dimension | Manual spreadsheet reporting | Dashboard-only | AI automation pipeline |
|---|---|---|---|
| Assembly time per report | 6–10 hours | 0 (but setup takes weeks) | 0 (review takes under an hour) |
| Data freshness | Days to weeks old | Near real-time | Hours (overnight build) |
| Narrative and “so what” | Yes, written by a tired human | No — charts without context | Drafted, human-approved |
| Cross-source reconciliation | Silent, in formulas | None — each widget is its own truth | Explicit exceptions for a human |
| Anomaly detection | Only if someone looks | Only if someone looks | Flagged automatically each cycle |
| Ongoing maintenance | Breaks on every rename | Breaks on every API change | Centralized, monitored, logged |
| Error profile | Copy-paste errors, hidden | Stale credentials, silently | Visible exceptions, audited |
The bottom line
AI automation does not replace the marketing report — it replaces the assembly line behind it. The pipeline pulls, cleans, reconciles and drafts overnight; the human keeps the jobs that were ever actually human: deciding what the numbers mean, approving what leaves the building, and acting on them. If your report takes a day to build and arrives stale, the question is not whether the technology works — it is whether you would rather have your best marketing mind spending Monday on spreadsheets or on strategy.
Still emailing dashboard screenshots to clients every Monday?
Send Dork Industry one sample of your weekly marketing report. We will map every data source in it, name the reconciliation conflicts a pipeline would surface, and show you the 30-day pilot we would run on your highest-pain report.
Request a free reporting automation assessment WhatsApp +91 8210792477
About Dork Industry
Dork Industry (dorkindustry.com) is a custom software development company building mobile apps, AI automation, and IoT systems for businesses across India. Our team designs overnight reporting pipelines, data reconciliation systems and approval workflows — from 30-day reporting pilots to full multi-client agency platforms. We have applied the same automation discipline to back-office operations like AI automation for business processes and distributor procurement.
Frequently asked questions
How can I automate marketing reporting?
Start by listing every data source your current report uses, then connect them through their official APIs — GA4’s Data API, Meta’s Marketing API and the Google Ads API all support scheduled pulls. A pipeline pulls the data overnight, normalizes naming and currencies, reconciles conflicting numbers, and drafts the report for a human to approve. Run it in parallel with your manual process for two to four weeks before trusting it.
How long does it take to automate one marketing report?
A focused pilot for one report over two or three clean API sources typically takes about 30 days: one week for inventory and connections, one week to build the pipeline in parallel with the manual process, one week to tune reconciliation exceptions, and one week to wire the approval workflow. Messy spreadsheet-only sources add time.
Will AI automation replace my marketing analyst?
No — it replaces the assembly work, not the analysis. The pipeline does the exporting, pasting and reconciling; the analyst does the judgment: what moved, why it matters and what to do next. Teams that automate usually redeploy the freed hours into strategy and testing, which is work the pipeline cannot do.
What happens when the ad platforms and my CRM disagree?
They will — every platform attributes conversions differently. A good pipeline does not silently pick a winner; it compares sources against a tolerance and writes flagged exceptions, for example when Meta reports 20% more leads than the CRM shows. Those exceptions are reviewed by a human, which is more honest than the manual process that buried them in formulas.
Can an automated report be trusted to send to clients directly?
Not without a human approval step. The pipeline should produce a review-ready draft — charts, narrative and exception flags — that a named person checks and approves before it reaches any client. Direct-to-client autopilot is where wrong numbers become contract problems, so the approval gate is non-negotiable.